Venue foot traffic insights using the BestTime.app Forecast tool
Using the foot traffic forecast tool we can get useful insights like on what day of the week most visitors will come to a venue and at what time
Supercharge store visitor insights using foot traffic data. In this tutorial, we will give a quick introduction to accomplish this using the ‘forecast tool’ from BestTime.app. Using the foot traffic forecast tool we can get useful insights like on what day of the week most visitors will come to a venue and at what time. You only need to fill in the name and address and BestTime will instantly try to generate a foot traffic report for you.
A quick intro to BestTime. BestTime.app is a data analytics company that provides instant foot traffic data for stores in 150+ countries.
- Predict (forecast) at what time of the week most visitors come to a venue (e.g. a store, bar, attraction, or restaurant).
- Live updates if it is more or less busy than normal (real-time).
- Compare foot traffic of multiple venues.
- Filter venues in a whole area based on visitor peaks, day, time, and business type (radar tool).
- Integrate all data directly into your applications using the developer REST-API.
You could compare it with a supercharged Google Popular Times API with more footfall data functionality.
In this tutorial, we discuss how to use the ‘Forecast’ website tool to get instant foot traffic predictions, analyses for a week, and live data to see if it is more or less busy than normal. In the next articles, we discuss how to compare foot traffic of venues, filter venues in specific areas based on predicted- & real-time foot traffic, time, day of the week, and venue category. All data is also accessible through the software API, but we will discuss this as well in another tutorial.
To get started we first need to sign-up for a free membership. The membership includes some free credits to get started. There are also some demo tools available on the website that do not require any registration but by registering we get more functionality.
Forecast tool
To get foot traffic data BestTime needs to know the name and address of a venue (public business, like stores, restaurants, etc) before it returns foot traffic data. BestTime generates foot traffic forecasts for every hour of the week. We are going to manually add a few venues using the foot traffic ‘New Forecast’ tool. In future articles, we will talk about adding venues using the developer’s software API.
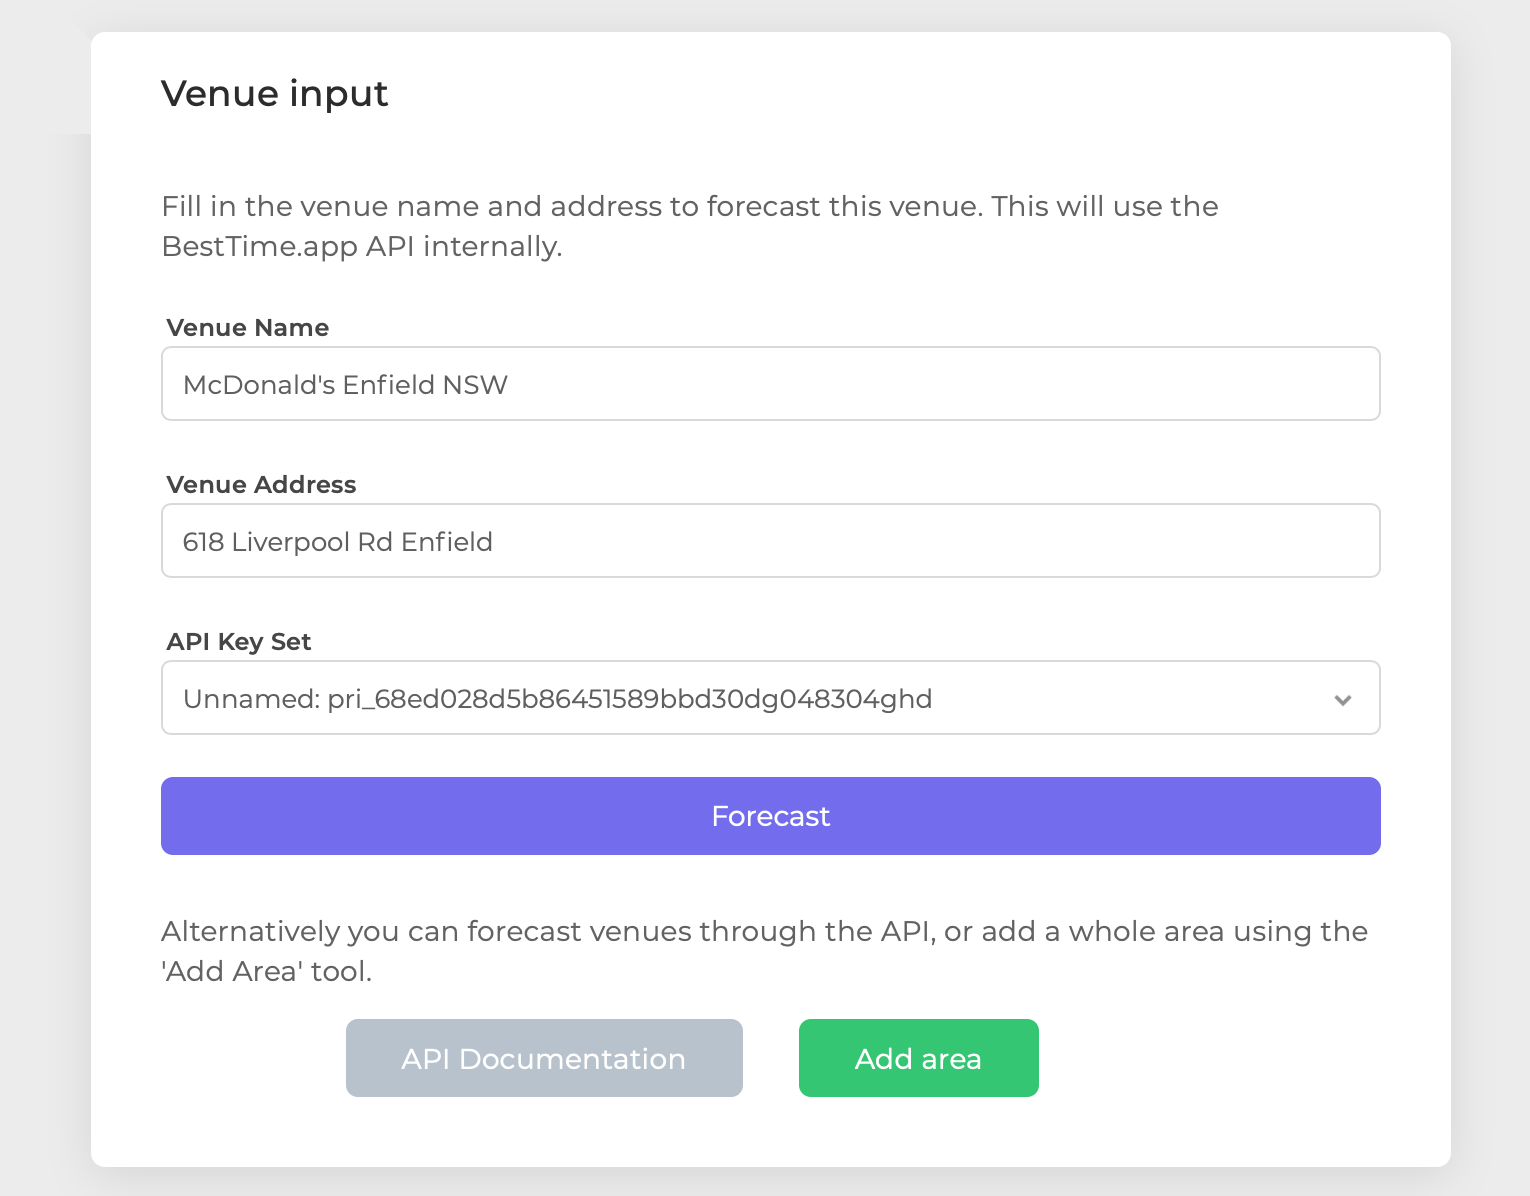
Click in the left menu on ‘ New Forecast’ and the page asks you to fill in the name and address of the venue. Click on the auto-suggested address for the best results. In this example, we request foot traffic data for a Mcdonald’s in Australia.
You can ignore the API Key Set field, and click on the purple Forecast button. It usually takes a few seconds.
The foot traffic forecasts are based on historical venue visits in the past few weeks. BestTime will now look if there is enough data to create a foot traffic forecast for that specific venue. If not, the tool will give a reply that the venue is found, but there is not enough data at this moment to generate a forecast. Both rural and urban venues should have coverage as long as there have been enough visitors in the past few weeks. Please check the name and address again if you get an error that the venue address itself is not found.
If there is enough data you will get a foot traffic forecast overview for the current day of the week divided into multiple sections:
Day & week overview buttons
Using the gray buttons in the top-right corner you can switch between foot-traffic data for each day of the week, or get a week overview (later more on this).
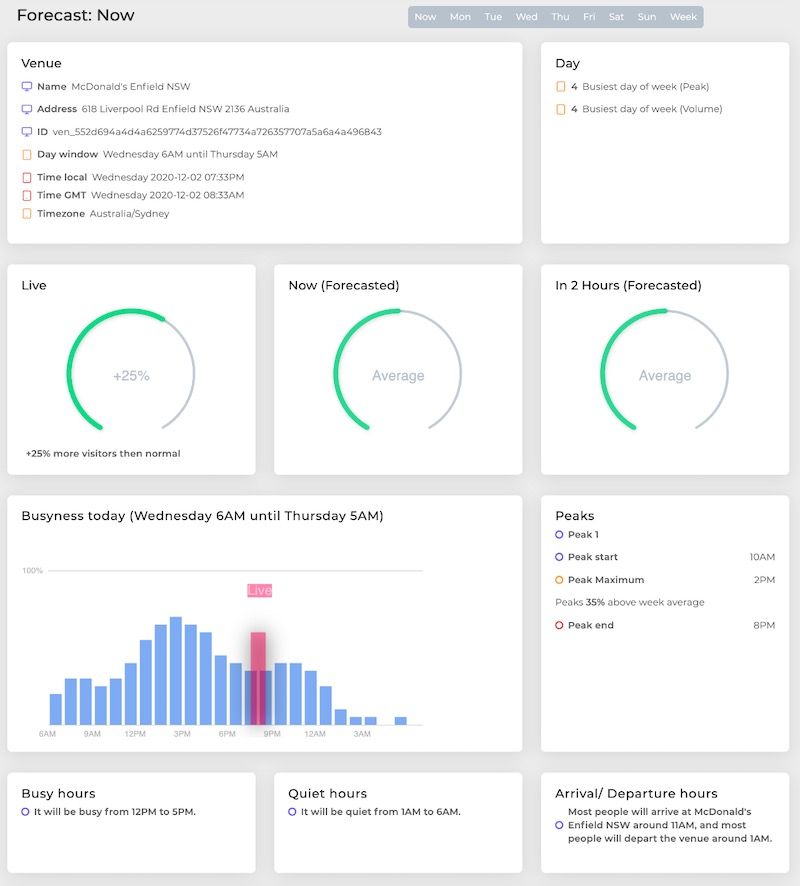
Venue
Besides the venue name and address, it will show what time it is at the venue in GMT and local time. In this case, the displayed foot traffic forecast is for Wednesday (6 AM until Thursday morning 5 AM)
Day
Shows the week ranking for the current day (from 1 to 7) in terms of foot traffic peak and daily volume. Wherein 1 means that this day has the biggest visitors peak or volume (more about this later in the ‘Week’ page section).
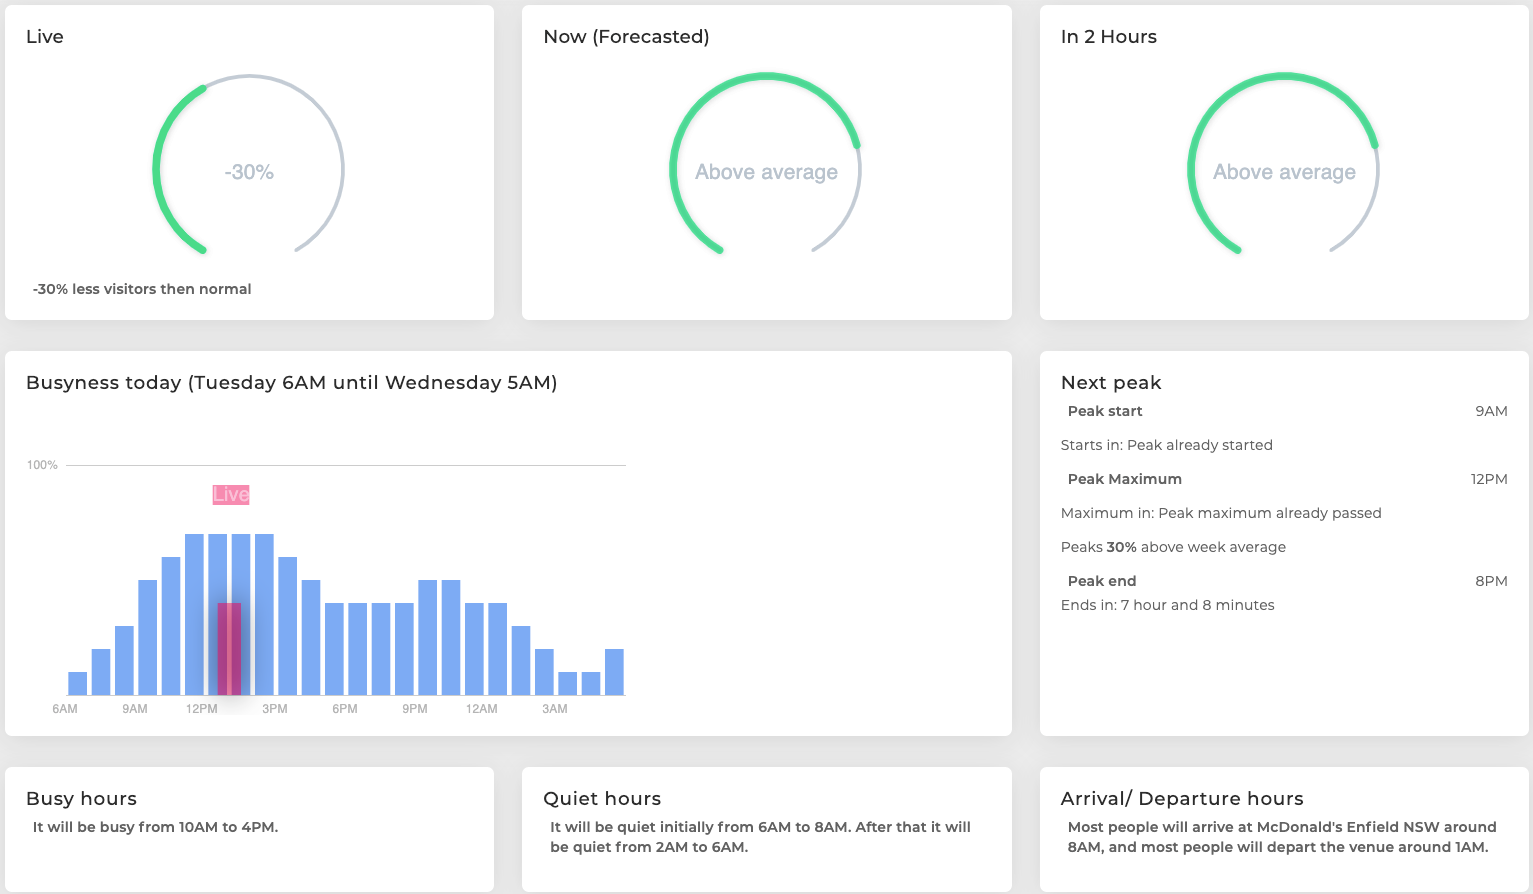
Live
The live gauge displays how much more or less busy it is at this moment, compared to the average of previous weeks (on the same day of the week and hour). A positive number means it is busier than normal, and visa versa for a negative number. In this case, BestTime suggests that there are 25% more visitors for this hour than in the past weeks. Live data is not always available for each venue.
Now (Forecasted)
Displays a forecast of how busy it will be at this hour compared to the rest of the week. This data is based on historical visits from previous weeks and indicates how busy the venue is on a scale of 5: `Low`, `Below average`, `Average`, `Above average`, or `High`. When the venue is closed at the given hour it indicates `Closed`.
In 2 hours (Forecasted)
Similar to ‘Now (Forecasted)’ but shows a forecast for 2 hours ahead.
Busyness today
Shows a chart of today’s forecasted foot traffic per hour (in blue). The foot traffic is expressed as a percentage from 0 to 100%, wherein 100% is the foot traffic peak of the week. If live data is available it will be displayed on the current hour in pink. The live percentage could go well above 100%. This means it is busier than the normal (forecasted) peak of the week.
Peaks
Displays forecasted visitor peaks for the current day. It tells you at what time the predicted peak starts, when it is at its maximum, and when it is over. It only shows one or more ‘significant’ peaks that are above the visitors’ week average.
Busy & quiet hours
Tells you which parts of the day will be busy or quiet.
Arrival/ Departure hours
Tells you at which hour of the day the most people in a given hour enter or leave a venue. E.g. useful to know at what time you should go to a restaurant to get a table before everybody else comes, or get a prediction of what time a party in a bar will be over.
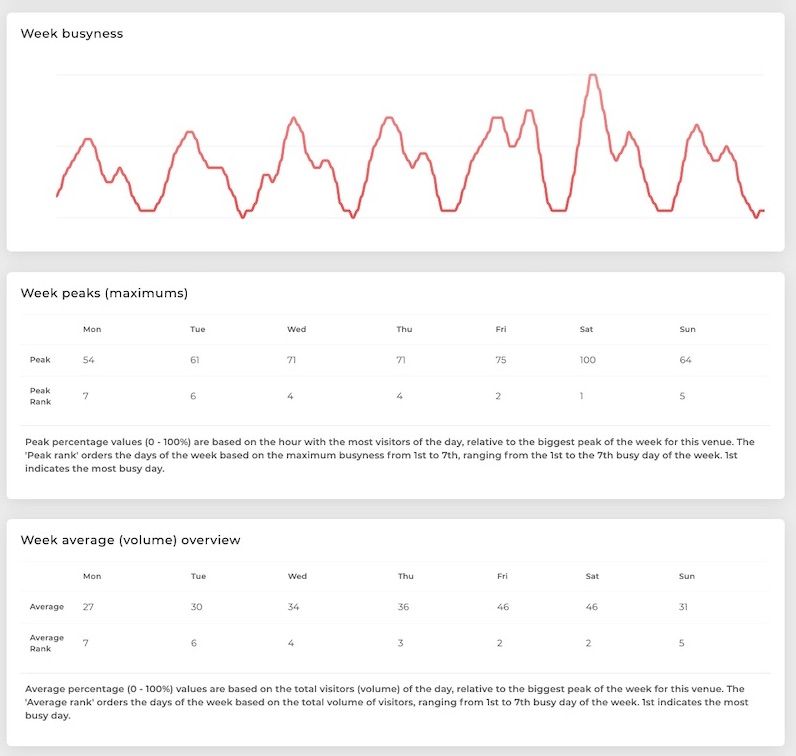
Week overview
The week overview page displays a chart of the forecasted foot traffic data for the whole week. By hovering over the chart you can see the day, time, and traffic percentage (0 to 100%).
Week peaks (maximums)
This table shows the peak percentage for each individual day of the week (0 to 100%), and a peak ranking (1st — 7th). 1st indicates the day with the highest peak of the week.
Week average (volume)
Similar to the ‘week peaks’, but based on the total volume per day instead of only the peak per day.
Good to know
You can add as many venues to your BestTime account using the ‘New Forecast’ button (as long you have credits left in your account). By clicking on the ‘ Forecasts’ button in the left main menu you will get an overview of your previously successful forecasted venues.
All tools use the BestTime API under the hood. Each API requests require a certain amount of API credits. On the user Setting page, you can see your remaining credits. From this page, you can also click on ‘ API Usage’ to see when and on what type of API endpoint you have spent your credits. You can also sign up for a paid subscription to get more data. BestTime offers ‘pay as you go’ plans and several unlimited plans. With the ‘pay as you go’ plans, BestTime bills you automatically at the end of the month depending on how many API credits you have used. With the unlimited plans, you don’t have to worry about unpredictable prices. Each unlimited plan comes with unlimited API calls, but each of the plans is capped at a maximum amount of unique venues per month. The Unlimited plans also have the advantage to retain the forecasts longer on the server before they expire. If a forecast expires you have to forecast them again.
Next steps
In future tutorials, we will discuss the other website tools like the ‘Compare’ and ‘Radar’ (venue filter) tool. We will also discuss in other tutorials how to get the same data from the website tools through the software API. Meanwhile you can check the BestTime API documentation.