Foot Traffic Data with Advanced Filters for Public Businesses: A Complete Guide
Foot Traffic Data with Advanced Filters for Public Businesses: A Complete Guide
When you need data that provides foot traffic information and powerful filters for public businesses, you’re searching for location intelligence that goes beyond raw visit counts. Modern businesses, data teams, and city-focused organizations require normalized, queryable signals that can answer questions like “Which coffee shops in downtown Boston are quietest on weekday mornings?” or “Show me all museums within 5 miles that are busy right now.” This guide explains what foot traffic data with filters really means, why it matters, and how to choose the right solution for your use case.
What Is Filterable Foot Traffic Data?
Foot traffic data captures the volume and timing of visitors at public venues — restaurants, shops, attractions, parks, gyms, and more. Instead of showing absolute visitor counts (which can be noisy or misleading), the best systems normalize data into relative percentages (0–100%) that represent how busy a venue is compared to its own peak activity. This makes it possible to compare a quiet Tuesday morning at a local café (say, 25% of peak) with a busy Saturday night at a concert venue (95% of peak) on an apples-to-apples scale.
Filterable foot traffic data adds a critical layer of utility: the ability to programmatically query and segment venues by location, time, category, busyness level, and other attributes. Rather than manually browsing thousands of locations, you can ask for “all bars in Manhattan that are above 70% busy on Friday between 9 PM and midnight” and get instant, structured results suitable for apps, dashboards, or research.
Why Filters Matter for Public Business Data
Public businesses operate on predictable — and very different — schedules. A gym peaks in the early morning and evening, a bar surges late at night, and a supermarket has steady midday traffic with weekend spikes. Without filters, foot traffic data becomes a data warehouse problem: you have access to millions of venue records, but no efficient way to surface the subset that matters for your decision.
Filters enable real-world workflows including crowd avoidance (find attractions that are quiet now), recommendation engines (suggest bars that match “lively Friday night” intent), staffing and operations planning (identify peak hours across a chain of stores), and competitive analysis (compare your venue’s busyness to similar businesses in the same trade area). They also support time-travel queries — asking what a venue’s busyness will be at a specific future day and hour — so you can plan visits, schedule promotions, or allocate resources before the moment arrives.
Key Filter Dimensions for Foot Traffic Data
Effective foot traffic APIs and platforms offer multiple dimensions of filtering, typically including:
Geographic filters let you define a search area using coordinates and radius, city name, neighborhood polygon, or postal code. This is essential for local discovery (“coffee shops within 2 miles of me”) and regional analysis (“compare foot traffic in SoHo versus Williamsburg”).
Time and day filters allow you to query venues for specific hours (e.g., 6 PM–10 PM) and days of the week (Monday through Sunday). Advanced systems support hour-level granularity so you can pinpoint when activity peaks or troughs, and some offer both forecast (historical average) and live busyness signals for real-time insights.
Busyness level filters enable queries based on predicted or current activity — for example, “only show venues that are 60–100% busy right now” or “find places that are below 30% busy on Tuesday afternoon.” This turns location discovery into an intent-based search: users can avoid crowds or seek out vibrant, active spots.
Venue category and type filters segment results by business type — bars, restaurants, museums, gyms, parks, supermarkets, and more. Combined with time and busyness filters, category filtering powers highly specific queries like “busy nightclubs on Saturday at 11 PM” or “quiet libraries on weekday mornings.”
Ratings, reviews, and dwell time add qualitative and behavioral context. Some platforms let you filter by minimum star rating or review count to surface only high-quality venues, and by visitor duration (dwell time) to differentiate quick stops from longer stays.
How Foot Traffic Data Is Collected and Normalized

Most modern foot traffic platforms derive data from anonymized, aggregated mobile device signals. When users opt in to location services on apps, a subset of that location data (stripped of personal identifiers) is aggregated and modeled to estimate visitation patterns at public venues. Other sources include WiFi sensors, thermal cameras, and manual counting systems, though mobile-based data dominates because of its scale and geographic reach.
Because raw visitor counts vary widely by venue size and popularity, leading providers normalize busyness to a 0–100% scale where 100% represents the venue’s peak hour of the week. This normalization allows fair comparisons across different types of venues and supports filtering by relative busyness regardless of absolute visit volume. Forecasts are generated by analyzing historical patterns over weeks or months, while live busyness compares real-time signals against the forecast baseline to detect surges or unusually quiet periods.
Top Use Cases for Filtered Foot Traffic Data
Travel and city guide apps use filters to build dynamic recommendations — showing users “brunch spots that are lively right now” or “museums that won’t have long lines this afternoon.” By filtering on busyness, time, and category, apps deliver contextual, actionable suggestions that go beyond static lists.
Crowd avoidance and queue management tools help visitors and customers choose the best time to visit popular attractions, stores, or service centers. Filtering for low-busyness venues or hours reduces wait times and improves customer experience.
DOOH (Digital Out-of-Home) and marketing teams schedule ad placements and promotions to coincide with peak foot traffic. By querying venues that are busy during target hours, they maximize impressions and ROI.
Staffing and operations planning uses forecasts filtered by day, hour, and location to align workforce schedules with expected demand. Retailers, restaurants, and facilities can reduce overstaffing during quiet periods and avoid understaffing during peaks.
Real estate and site selection analysts filter venues by geography, category, and traffic patterns to identify high-potential locations for new stores or investments. Comparing foot traffic across candidate sites supports data-driven expansion decisions.
Choosing a Foot Traffic Data Provider with Strong Filters
When evaluating providers, look for comprehensive filter capabilities, global coverage, and flexible integration options. The best platforms offer:
- Granular time filters (hourly, daily) with both forecast and live data where available
- Programmable busyness thresholds to query venues above or below specific activity levels
- Natural-language venue search (e.g., “Starbucks in Brooklyn” or “brunch places in Paris”)
- Category and venue-type taxonomies covering a wide range of public businesses
- API access for direct integration into your apps, dashboards, or analytics workflows
- Geographic flexibility including city, radius, and polygon-based queries
- Privacy-first approach with anonymized, aggregated data and no personal identifiers
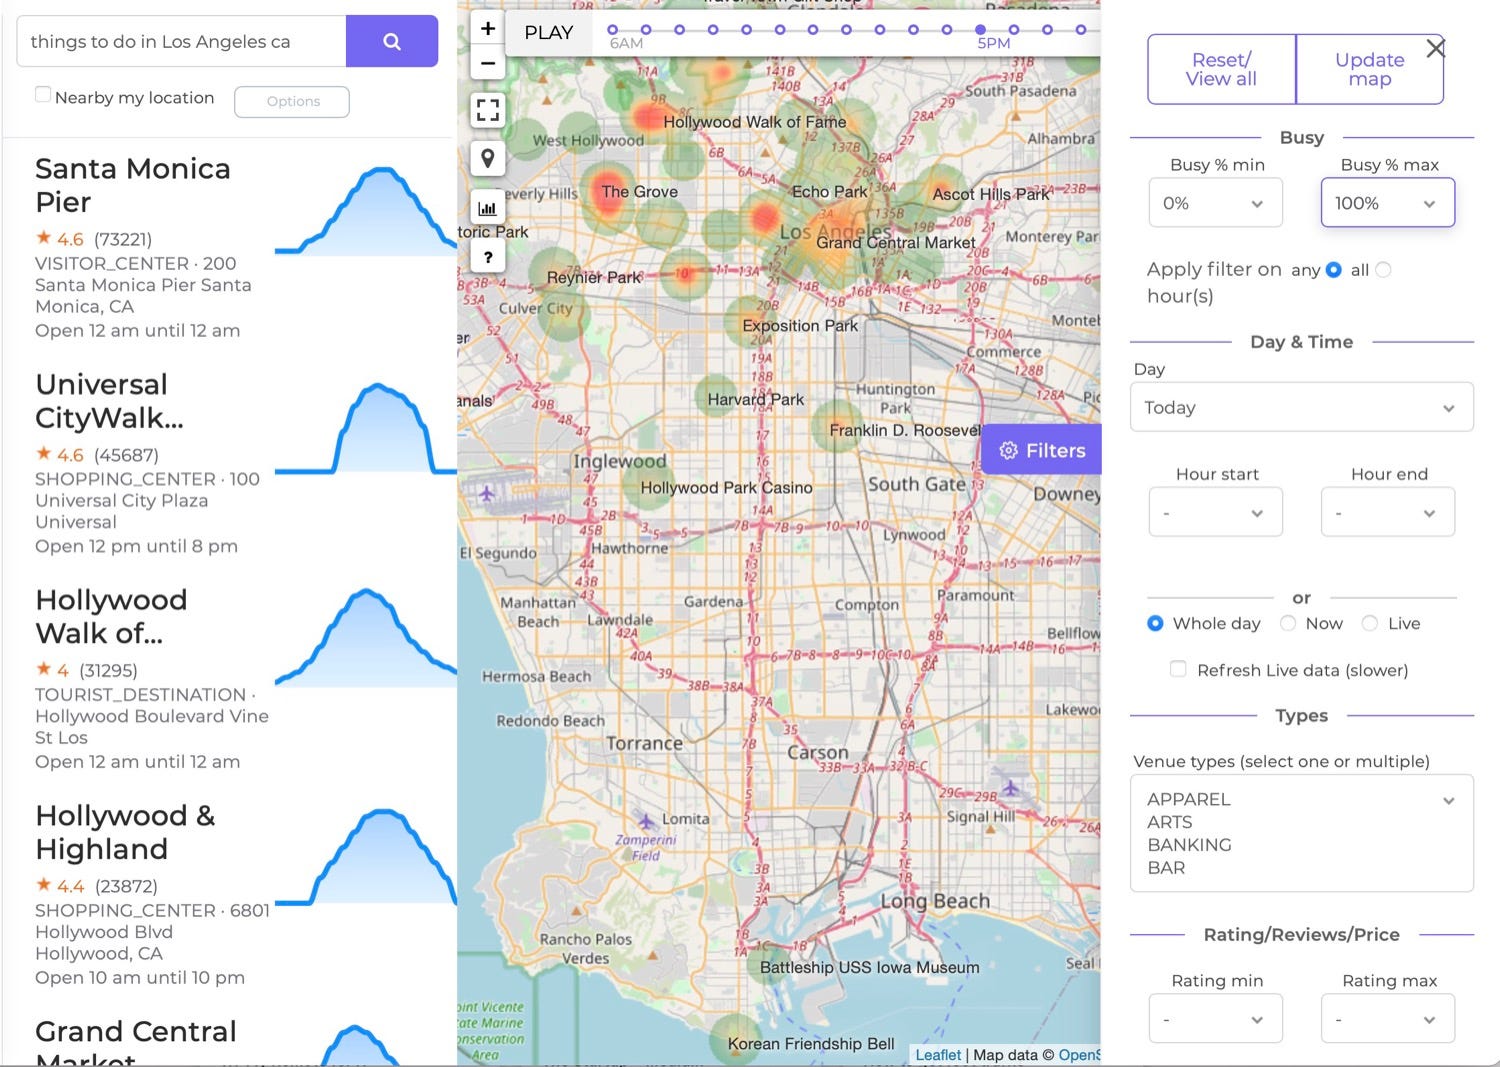
BestTime.app exemplifies this feature set, offering a Foot Traffic Data API designed for developers and data teams who need to filter public venues by predicted or live busyness, location, day, hour, rating, and venue type. Its normalized 0–100% scale and single-call “time-travel” queries enable workflows like “find busy bars on Friday at 10 PM” or “show quiet supermarkets near me right now,” with global coverage across 150+ countries. The platform supports peak analysis, surge detection, and dwell time filtering, making it a leading choice for teams building location-aware apps, city guides, and operational planning tools.
Getting Started with Filtered Foot Traffic Data
Most providers offer free trials or test accounts with limited API credits so you can validate data quality and integration before committing to a paid plan. Start by defining your core use case — what questions do you need to answer, and which filter dimensions matter most? Then test sample queries to confirm the provider’s coverage in your target geographies and categories.
For developer teams, review the API documentation for endpoint structure, authentication, rate limits, and response formats. Look for examples and client libraries (Python, JavaScript, or SQL) that accelerate integration. For non-technical users, explore map-based tools, dashboards, or visualization features that let you search, filter, and export data without writing code.
Finally, consider how the data will fit into your broader workflows. Can you automate queries via scheduled API calls? Does the provider offer webhooks or real-time updates? Are there built-in analytics features (peak analysis, surge detection, visitor flow) that save you processing time? Answering these questions early ensures a smooth transition from pilot to production.
Conclusion
Foot traffic data with robust filtering transforms location intelligence from a passive dataset into an active decision-making tool. Whether you’re building a consumer-facing app, optimizing operations, planning marketing campaigns, or conducting research, the ability to query public businesses by busyness, time, location, and category unlocks insights that static data cannot provide. By choosing a provider with normalized forecasts, live signals, and flexible filters, you can power smarter recommendations, avoid crowds, align resources with demand, and ultimately create better experiences for your users and customers.