Retail store foot traffic data
Analyze how different store locations are performing and which days of the week have more visitors than others.
Foot traffic data helps businesses understand how busy a store is and what time of day has the most visitors. A lot of data is being collected by retail stores themselves, but most of the data is not public. Foot traffic data can be used to analyze how different store locations are performing against each other and which days and hours of the week have more visitors than others. Using the foot traffic data and tools from BestTime.app, you can access and analyze this data too:
- The data includes a foot traffic prediction (percentage ) for every hour of the week (24 x 7). Within this data 100% represents the peak hour of the week.
- Most retail stores include an hourly updated foot traffic indication (live data)
- Compare which store has the highest and lowest visitor dwell time
- Using the filter tools, you can, for example, find the busiest stores at any day and time of the week.
- Integrate and automate the foot traffic data into your own business using the BestTime foot traffic data API (or export it to Excel/ CSV).
- The data is based on anonymous mobile GPS data.
BestTime provides foot traffic data for public venues like shops, malls, restaurants, and museums using mobile GPS signals. Therefore, no expensive counting sensors or renovations are needed. This data can also be used by third parties using the software API to optimize retail at scale. The foot traffic data includes a forecast for every hour of the week. Some popular venues also have live data available. This shows how much more or less busy a building is compared to the foot traffic in the past few weeks for that hour.
Wallmart
BestTime has foot traffic data on worldwide (retail) stores like Walmart, Ikea, Mcdonald's, etc. In the example below you see a demo set of Walmart's in California using the BestTime Radar tool. The tool can be used to find and filter stores.
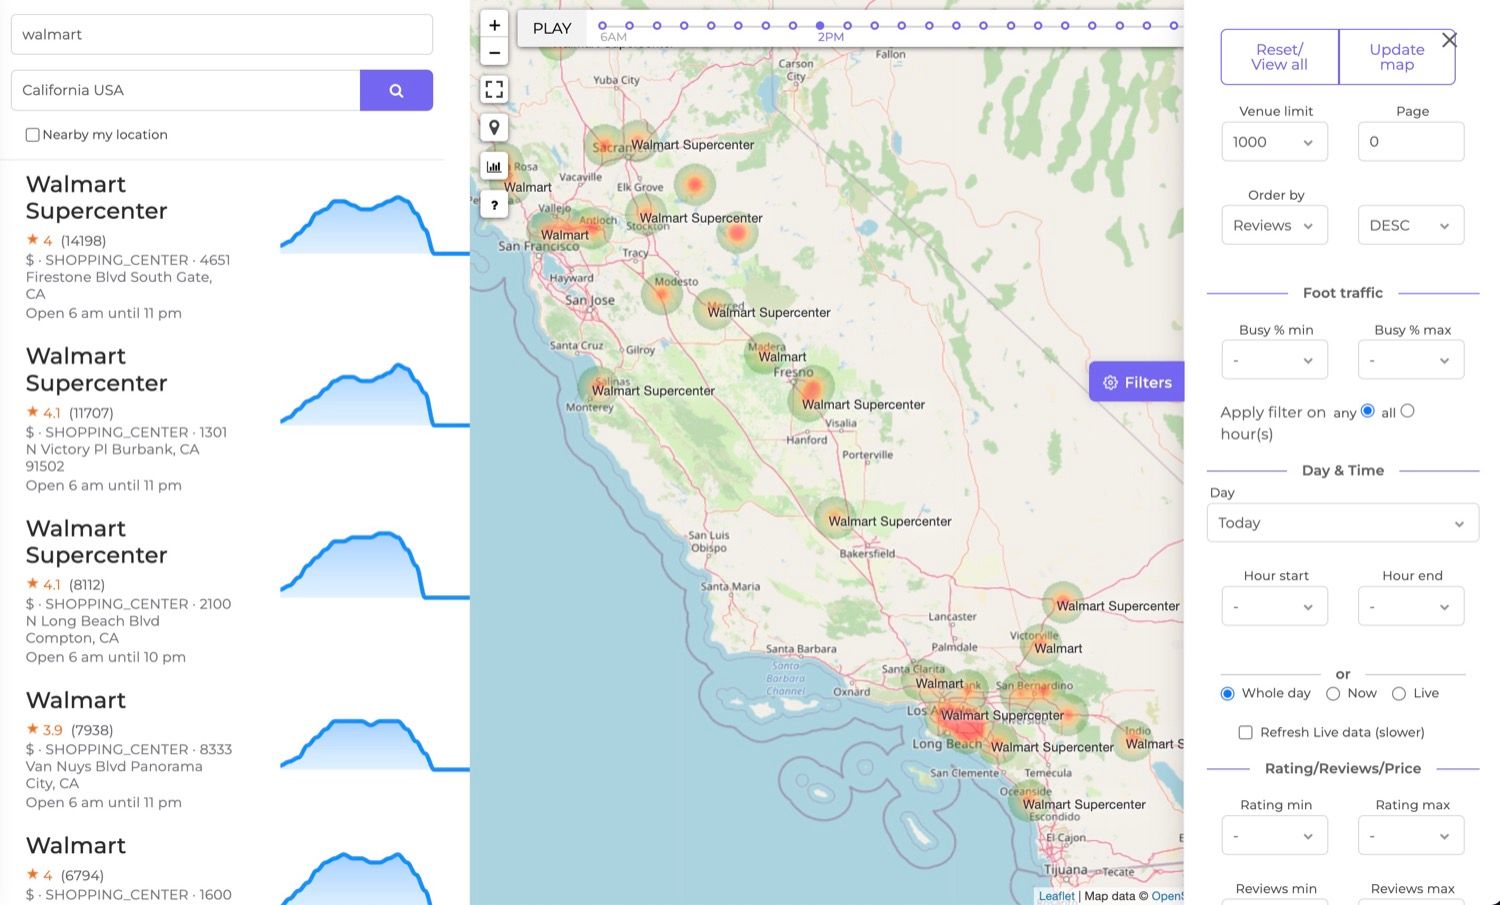
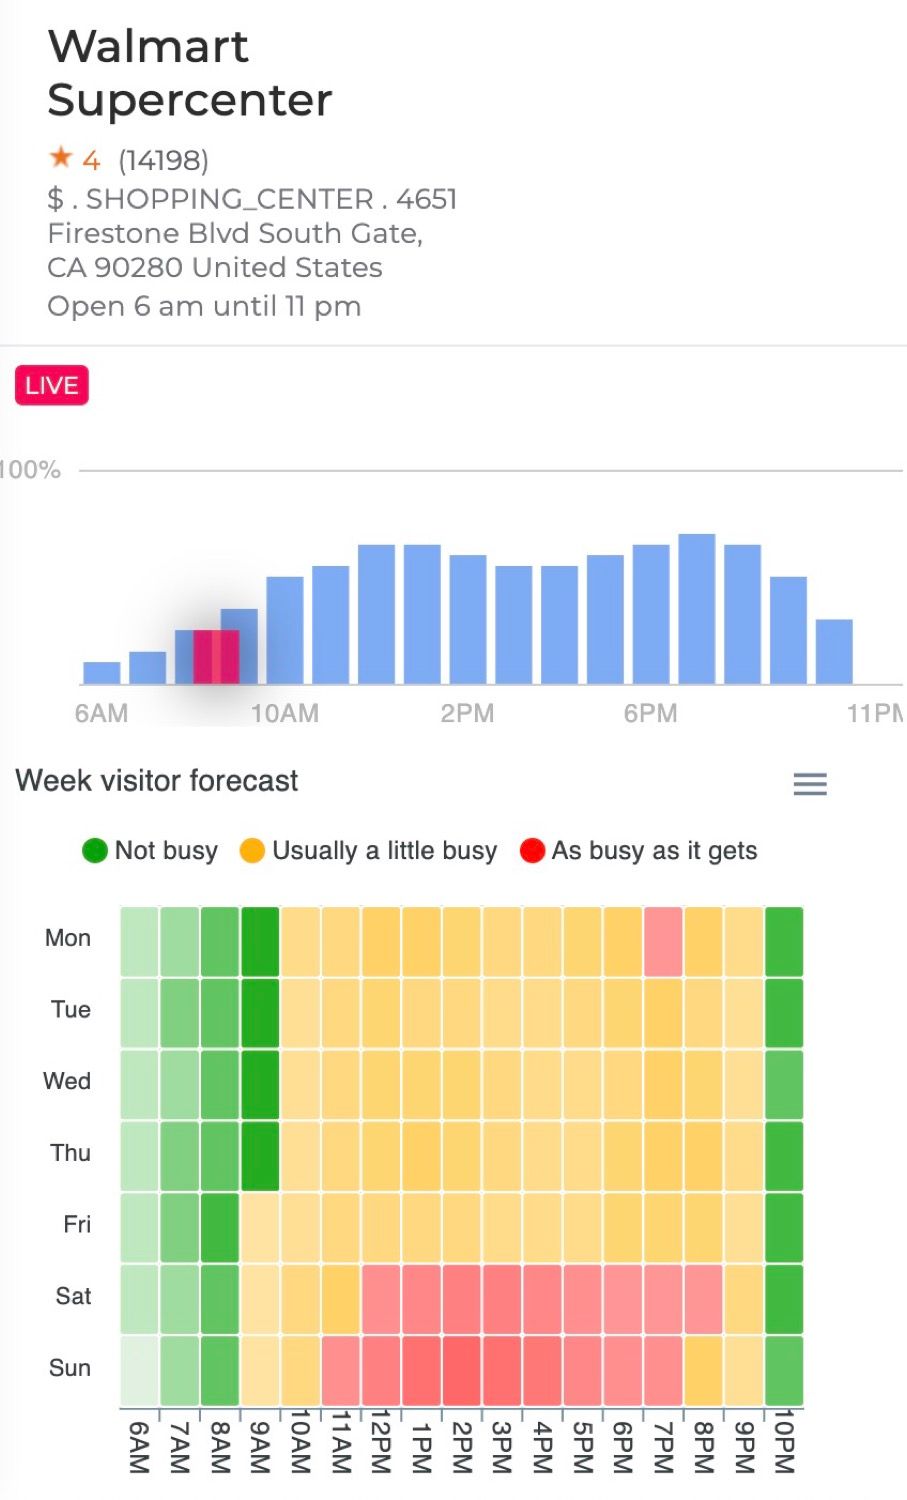
When clicking on a store in the left menu, you will get more details (see picture below). You will see the foot traffic percentage predictions for today and - if available - the live foot traffic status. Below that, you will see a heatmap of the week. It shows all the open hours of the store, and the color represents how busy it is predicted to be.
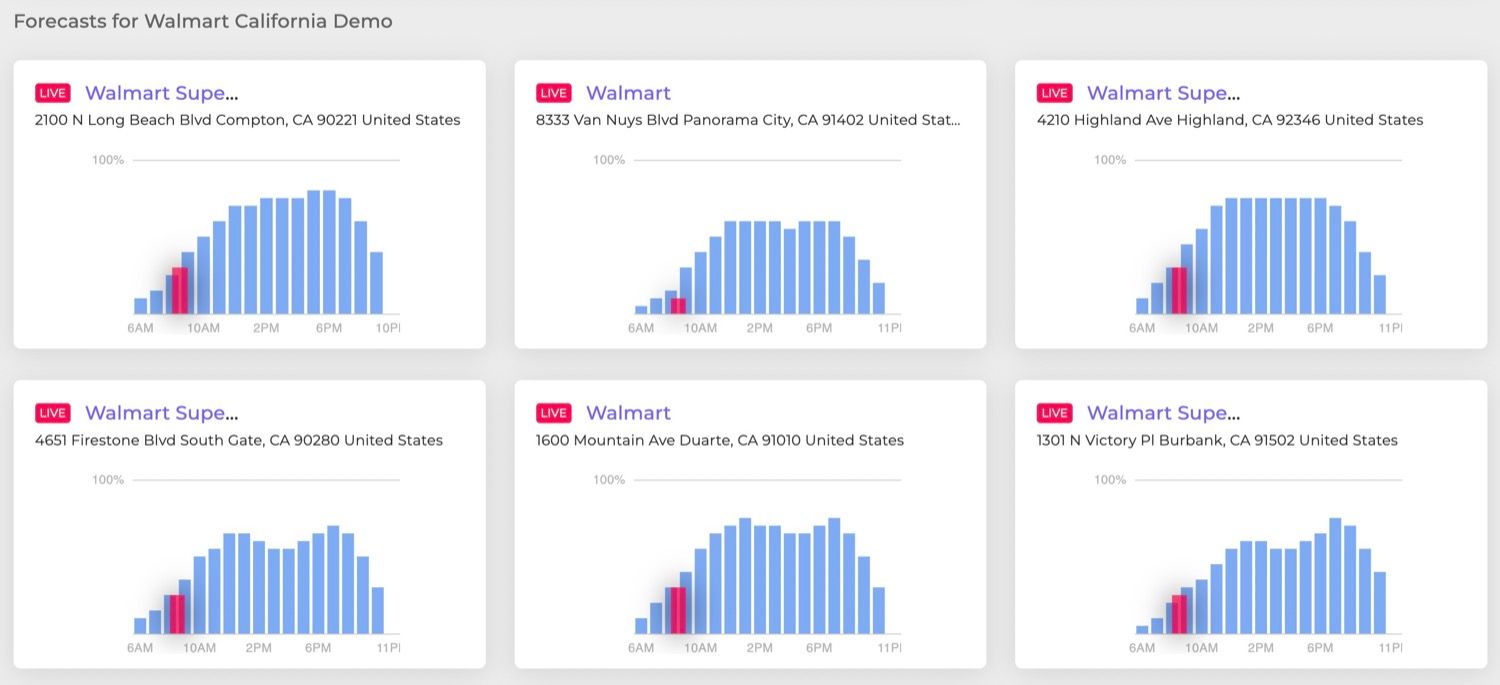
BestTime also includes tools to create a dashboards (see picture below) with your own selected stores (see Walmart demo). It contains the foot traffic predictions for today and the live data. Contact us for more information.
