Search & filter venue foot-traffic around the world
Search and analyze world-wide foot-traffic data in order to find the best venues for whatever your needs may be. Whether it's finding where to go out Friday night or visiting a grocery store when it's less busy
There are plenty of ways to find what you’re looking for in a city, but not all of them work as well as they should. This article discusses how you can use foot-traffic data to be the smartest in the room. The used tool lets you search and filter worldwide venue foot-traffic data in order to find the best venues for whatever your needs may be. Whether it’s finding where to go out Friday night, visiting a grocery store when it’s less busy, improve digital outdoor ads efficiency, or researching mobility trends, this might be the tool for you.
Using the BestTime.app Venue Search in the Radar tool you will be able to filter the foot-traffic data on visitor peak, day/time, geographic area, and business type, reviews, rating and price level. For example “Busy bars in San Fransisco Friday evening”, “Quiet supermarkets Sydney Australia on Sunday from 8 AM until 11 AM”, or “Things to do in New York City”. The data is also available through the BestTime.app software API.
In this tutorial, we will describe how the Venue Search and Radar tools work in general without any use-case in mind. In future tutorials, we will describe how to use this tool using the API and use-case-specific versions. For this tutorial, you need a free BestTime.app account to get started, but a paid subscription to analyze higher volumes of foot-traffic data. You can also use the free demo without registering, but not all functionality is included and includes and limited to only several searches per day.
A quick intro to BestTime. BestTime.app is a data analytics company providing instant foot-traffic data for venues in 150+ countries.
- Forecast at what time of the week most visitors come to a venue (e.g. a store, bar, attraction, gym, or restaurant).
- Live updates if a venue is more or less busy than normal (real-time).
- Search venues foot-traffic based on category (e.g. supermarkets in London) or name (e.g. McDonalds in San Fransisco).
- Filter venues in a whole area based on visitor peaks, day, time, and business type.
- Integrate all data directly into your applications/ research using the developer REST-API.
You could compare it with a supercharged FourSquare/ Google Popular Times API with more footfall data analytic functionality.
Quick Radar video demo
Adding new data
We start by opening the BestTime.app Radar Tool. The Radar tool is used to filter venues that are already added to BestTime by the user itself. You can get venue foot-traffic data one-by-one using the venue name and address (using the forecast tool/ API), or using multiple venues using the Venue Search tool/API - which we will discuss now.

Add new venue foot-traffic by using the Venue Search bar in the top-left of the screen. For example "Things to do in New York City", or "Bars in San Fransisco". Alternatively, you can find venues nearby by clicking "Nearby my location" in combination with a search query, e.g. "bars". Your browser might show a share location permission popup. The Venue Search tool will then use the estimated location (geographic coordinates) supplied by your browser to find places nearby you.
By clicking on the 'options' button more search options will appear.
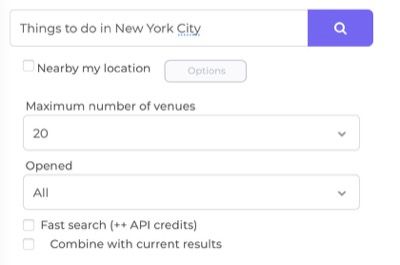
Number
Change the ‘maximum number of venues’ to increase the number of search results. The higher the number the longer it takes before the search is complete. The venue search tool will analyze each found venue on foot-traffic directly using the internal ‘Forecast’ tool/API. Besides the Venue Search credits used for this search it also uses credits for each internal Forecast. So the more venues the longer and more credits it will cost.
Opened
By default venues with all types of opening hours are searched (option ‘all’). Using the option ‘24H’ the only venues that are open 24H are returned. By selecting ‘now’ only venues that are open at this moment are returned.
Fast Search
The Venue Search tool has two-speed options. ‘Fast’ and ‘Normal’. The results for both options are 99% similar, but by selecting the ‘fast’ option the search process is faster. However, the ‘fast’ option is using more credits. The ‘fast’ option can only be used to search for a maximum of 60 venues per search. The ‘normal’ search speed supports up to 200 venues per search (in the future this number might increase). If you select the ‘fast’ option and a number higher than 60 it will automatically use the ‘normal’ speed.
Combine with current results
Normally, each new Venue Search result will only show the data of venues from the most recent search request. By selecting “combine with current results” the new results will be combined with the data already shown in the Radar tool. This way you can e.g. combine the search results for restaurants and supermarkets together. Internally this is done by adding the venues from the new result to an existing collection of venues. Later more on venue collections.
More search options
The Venue Search bar in the Radar tool only shows a few search options. For more search options you can use the dedicated Venue Search page, or the Venue Search API endpoint. Later more advanced search requests will be discussed in this tutorial.
Search results
Click on the search icon to start the search. The search could take a while, depending on your search speed, number of venues, and if a similar search has been performed recently. When the search is complete the page will be reloaded with the new search results.
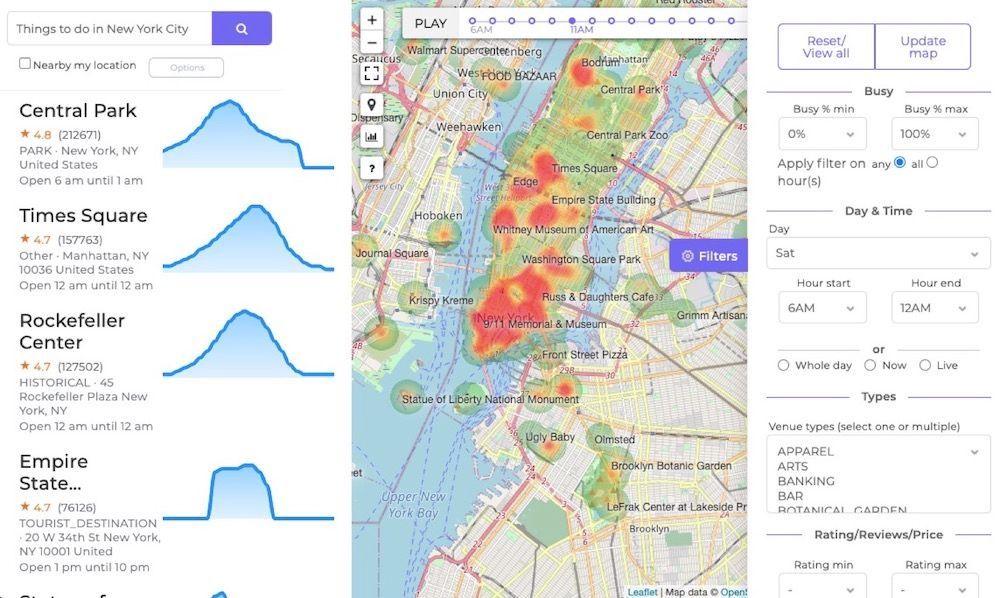
The Radar tool will show the venue foot-traffic data in the middle as a heatmap. On the left side of the Radar tool a list of venues is displayed including venue information and foot-traffic data for today. You can hover over the foot-traffic data to use the corresponding hours. Scroll down to see all venues shown in the Radar map.
Foot-traffic details
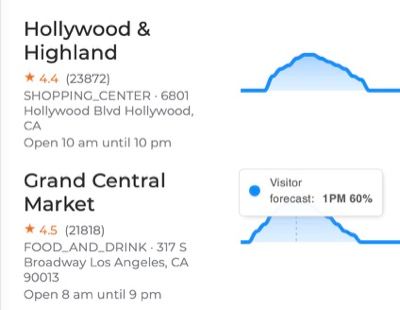
See more venue foot-traffic details, by clicking on a venue on the left-side or on the heatmap.
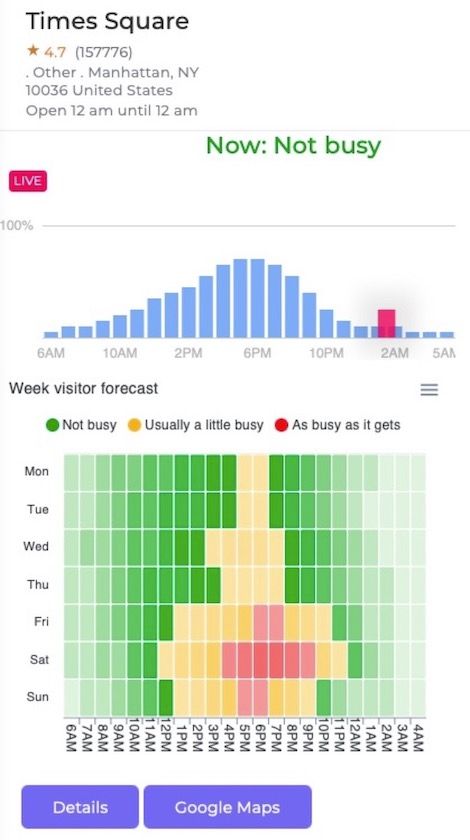
On top, the foot-traffic forecast for today is shown (indicated as a percentage from 0 to 100%). Sometimes live data is available and displayed in Pink (from 0 to 200%). Beneath that is a week foot-traffic forecast chart shown. The color represents how busy it is predicted to be. Hover with your mouse over an hour to see the corresponding percentage (also from 0 to 100%). Click on the button 'details' to open this venue in the BestTime Forecast tool. This tool will show more in-depth foot-traffic analyses.
Heatmap
The heatmap in the center of the Radar tool will show the foot-traffic data of all loaded venues together on a map with a color representing how busy it will be according to the forecast for a given hour or real-time using the Live data. By default, the heatmap shows the foot-traffic data for current hour and day in the local timezone of the map. Green indicates a percentage of foot-traffic forecast of 0% and red 100% (similar to the day and week forecasts). When zoomed in far enough, each colored dot represents an individual venue. When zoomed out the dots and colors blend together. The resulting color is based on the average of multiple venues together. However over the heatmap for the venue names. Click on a venue dot for more information.
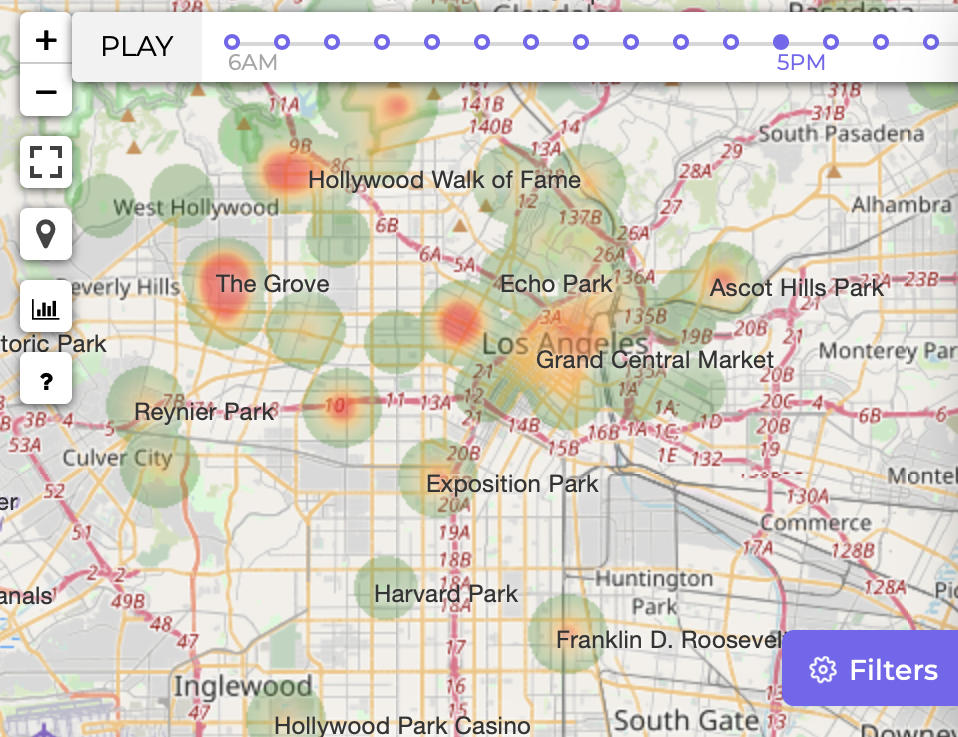
Timeline
A timeline on top of the heatmap indicates by default the current hour in the local timezone of the map. Without active filters, the hours in the timeline range from 6 AM until 5 AM the next day (following the default BestTime day window). By clicking on another hour of the timeline foot-traffic for the selected hour will be displayed. Click on the ‘Play’ button to automatically loop over each hour of the day, resulting in an animated heatmap.
Map buttons
In the top-left on the map are additional buttons displayed. From top to bottom: Zoom in and out using the + and — buttons. Show the heatmap fullscreen using the square fullscreen icon. Click the map pin to show your own location on the map. The chart icon will open show a popup to export currently loaded venues into the Compare dashboard tool (see today’s foot-traffic side by side). Click the question mark icon for more Help info.
In the middle right of the screen is the purple ‘filters’ button located. By default, the filter panel is shown, but it can be hidden/displayed using this button.
Filters
Filter options are shown on the right side of the screen. Using these filter we can filter currently loaded venues based on predicted foot traffic, live foot traffic, geographic location, day of the week, time of the day, venue type, rating, reviews, price level, collections, or a combination of the previous mentioned filters. This tool uses the Venue Filter API under the hood. Each time the filter is changed the API is called and charges API credits (depending on the number of venues filtered).
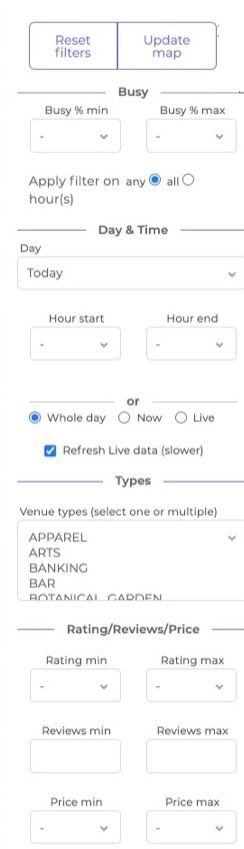
Reset/ View all
Click this button to remove all filters and collections. A venue search result is automatically loaded in a new collection. By clicking this button it will basically show all venues that the user has loaded before into BestTime in this location on the map. When the filters are too restrictive a popup will be shown that no venues were meeting the filter criteria. Deselect the last chosen filter or use this button to remove all filters.
Update map
The update map button is useful after dragging/ zooming the map. This will load all venues meeting the filters in the new map area.
Busy Min & Max & Configuration
Filter venues based on foot-traffic forecasts or live data using a minimum or/and maximum percentage. By default, the filter will return venues that have at least one hour of the selected day and hours that meet the min and/ or max busy filter. Change the configuration from ‘any’ to ‘all’ to let the filter only return venues that meet the min and/or max on all selected hours and selected day.
Day & Time
Filter foot-traffic data on a day by selecting the day of the week, or today for automatically showing the foot-traffic for the current day in the local time. A day can be narrowed down by adjusting the minimum and maximum hours (using the BestTime day window).
Whole day & Now & Live
By default, the ‘whole day’ is selected. After adjusting the minimum and maximum hours you can click on ‘whole day’ again to reset the hour filters.
Click on ‘Now’ toggle to filter the foot-traffic ‘forecast’ to today’s current hour in the local timezone of the venues on the map.
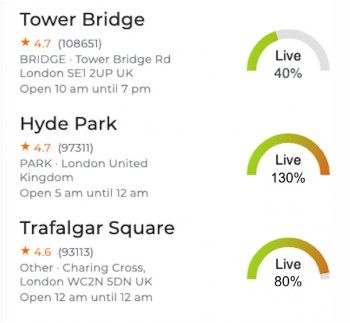
Using the ‘live’ toggle will show a similar result as the ‘now’ toggle, but shows how busy it is at this moment in real-time (opposed to the other settings that show a foot-traffic prediction based on historical visits in the past weeks). When the ‘now’ or ‘live’ mode is selected a foot-traffic gauge is displayed on the left side instead of a foot-traffic chart of today.
By default to save API credits, it will load live data of venues without refreshing the data. Check the ‘Refresh Live data’ button to refresh the live data for each individual venue. The filter result will take longer and will charge Live credits for each individual venue loaded in the Radar tool. It is recommended to only refresh the live data once per hour. Not all venues with forecast foot-traffic data have live data. Some not at all and some venues only during certain times of the day. So when selecting ‘live’ data it is normal that fewer or no venues will be displayed in the Radar tool.
Types
Filter down the venue results on venue type (category). See the Venue Filter APIdocumentation for all types. One or multiple types can be selected. Deselect all types to remove the type filter.
Rating & Reviews & Price
Filter the loaded venues on user rating, user reviews, and price level. Not all venues have a rating, reviews, and a price level. When one of these filters is selected, venues without that data will not be displayed.
Animate
Configure the animation speed of the heatmap after pressing ‘play’ on the heatmap (this is not a filter).
Location
Filter venues based on a point on the map with a radius in meters. The point on the map can be defined using the ‘latitude’ and ‘longitude’. In the Venue Filter API venues can also be filtered on a bounding box.
API key
Selecting a different one is only necessary if you have more than one API key set (most users have only one key set).
Collection
A collection is a group of venues and each collection has a unique ‘collection_id’. For every Venue Search, a new collection is automatically made and the venues from the search results are added to this collection (except when a search result is combined with current results). The collection_id is automatically displayed in the filter panel. By removing the collection_id the radar tool will show all previously loaded venues on that map (meeting the filter criteria). You can also fill in a previous collection_id from a manually curated collection or a previous venue search result. As discussed before, by selecting ‘Combine with current results’ in the Venue Search options the new search results will be added to the current loaded collection. You can find your existing collection on the Collection page. Collections that are automatically generated by a Venue Search are named after the search query. By clicking on a collection_id you will find links to open the collection in the Radar Tool or show a list of all containing venues.
No results meeting the filter criteria
The Venue Filter only returns venues that meet the filter criteria. Remove filters gradually to see which filter removes most of the items.
Add more venues using the Venue Search tool/API , or individually per venue using the venue name and address (tool/ API).
Depending on your account each venue foot-traffic forecast is only stored on the server for a predefined amount of days (see ‘days stored’ on the pricing page). We recommend refreshing venue foot-traffic forecasts every month. This can be done in bulk using the New forecast API endpoint, or manually for each venue using the New forecast website tool.
Advanced Venue Search filters
The filters in the Radar tool (Venue Filter API) can also be applied directly on the Venue Search tool/ API. If we for example want to find busy bars in San Fransisco we can use the Venue Search tool to search for “bars in San Fransisco” and subsequently add the filters “busy minimum = 50%”, Day = Friday, Hour minimum = 6 PM, maximum = 12 AM.
Besides the inputs as discussed in the ‘Filter’ section, the Venue Search also understands several textual filter inputs (see for more information Natural language filters in the search query as filters). These textual filters will be translated into normal filter parameters. When directly searched for “Busy bars in San Fransisco Friday night” using the Venue Search the same result will be displayed as the “Bars in San Fransisco” search query in combination with the earlier mentioned filters. You will also see that the textual filters activate the same filters on the right side of the Radar Search. Other textual filter examples are:
- “Busy bars in Sydney Australia Saturday from 8 PM until 11 PM” results in a search for “Bars in Sydney Australia” with filters set to: day = Saturday, hour min = 8 PM, hour max = 11 PM, busy min = 50%
- “Quiet supermarkets” + ‘Nearby me’ checkbox checked, results in “Supermarkets” in a radius of 5 kilometers nearby you (using the latitude and longitude provided by your device) with the filters set to: ‘busy max’ = 50%
The filters do not directly influence the venues search result from the Venue Search itself (except ‘opened’ and ‘live’), but will apply the filters on the linked Radar tool/ Venue Filter API results. So when searching for “bars in San Fransisco”
Other use-case examples
- Save time by avoiding the crowd and reducing risks by finding quiet supermarkets, shops, and shopping malls.
- Find out when and where the hippest bars using user ratings, reviews, foot-traffic, day, and time filters)
- Save money by optimizing outdoor advertising by tracking foot-traffic in neighborhoods.
- Analyze demand for specific venues or neighborhoods, like potential cab customers, or flex contractors in hospitality.
- Analyze if a venue promotion or event resulted in more visitors using the live data.
- Understand human behavior by for example when most people go to the beach or gym.
- Find venues that are more or less crowded than normal using live data
- If you are a marketer or publicist, you can now find out which venues have the most foot traffic on your target day and time. If you’re an event planner, venue owner, or advertiser
- When you’re looking for a venue, it’s hard to find out what time of day or day of the week is best. This data can help answer that question so you can make better decisions on where to go.
- Avoid waiting lines of popular hotspots like museums, and theme parks
- With BestTime.app you can find the best time to visit venues and get your product in front of a lot more potential customers.
- Optimize agenda meeting locations by suggesting the best time to go or avoid a venue.