BestTime beginners guide - Part 1 Website tools

In this tutorial, we explain all BestTime services together. In part 1 we discuss the website tools and in Part 2 we accomplish the same using the software API. We use bars in this tutorial, but the knowledge can also be applied to different use-cases.
Find the best time to visit popular bars & night club using foot traffic data
Most people rely on websites and social connections to discover to which bar or nightclub they should go. However, most sources don't tell you what is the best day and time to visit that actual venue. In this BestTime.app tutorial we explain how you can use BestTime to find the most popular venues and on which day of the week and time you should go to find the crowd. With this method we can for example see all busy and popular bars on Thursday evening in your desired neighborhood/city.
We first demonstrate how to do this using the BestTime website tools and afterward, we will accomplish the same using the BestTime software API. Using the software API you will be able to integrate the foot-traffic data into your own apps or websites. The website tools can be used without being a software developer, but for the software API a software background is recommended.
For this tutorial, you need a free BestTime.app account to get started, but a paid subscription to analyze higher volumes of foot-traffic data. The free account only contains 100 API credits. You can also use the free demo without registering, but not all functionality is included (like API access) and is limited to only several searches per day.
A quick intro: BestTime.app is a data (API) service that forecasts how busy a public business (e.g. shop, restaurant, gym, etc) will be at any given hour of the week using foot traffic data. The data is provided for 150+ countries. Foot traffic forecasts are based on average visits over the past weeks. Busyness for any given hour is predicted relative to the biggest peak of the week for this business. The foot traffic data is presented as percentages for each hour of the week from 0% (empty/ closed) to 100% (visitor peak of week). Additional BestTime functionality:
- Live updates if a venue is more or less busy than normal (real-time).
- Search venue foot traffic based on category (e.g. supermarkets in London) or name (e.g. McDonalds in San Fransisco).
- Filter venues in a whole area based on foot traffic visitor peaks, day, time, and business type, location, and more.
- Integrate all data directly into your applications/ research using the developer REST-API.
You could compare it with a supercharged FourSquare foot traffic data/ Google Popular Times API with more footfall data analytic functionality.
Quick Radar Demo introduction
Adding new data
There are different methods to get venue foot-traffic data:
- single venue using the name and address
If you have a list of bars in you can add them by name and address (e.g. 'Alchemist Bar & Lounge - 679 3rd St, San Francisco, CA' . This can either be done using the website forecast tool or with the software API. Adding a big list of venues through the website can be tedious, and therefore we recommend using the software API to automate this. - multiple venues using the 'Venue Search' tool
If you don't have specific bar names in mind but are looking for the most popular bars in a neighborhood or city you can use the Venue Search tool. This can either be done using the website tool or software API. The Venue Search result returns only 20 (default) to 200 (max) venues (this number includes venues that do not have foot-traffic data). So this tool only returns a limited amount of venues with each result. You can cover bigger areas by searching multiple times in different areas. You could for example search for bars in each individual neighborhood.
BestTime only adds a venue to your account if a venue had enough foot-traffic data in the past weeks. It doesn't really matter which method you choose to add venues to your account, and you can even combine methods Once venues are added to your account we can use the Radar tool (or Venue Filter for the software API) to filter bars in a whole area for example on foot-traffic intensity, day of the week, time, etc.
Website tools
In the sections below we first demonstrate how to analyze bars using the website tools. In the later sections, we describe how to accomplish the same using the software API.
Adding venues by name and address
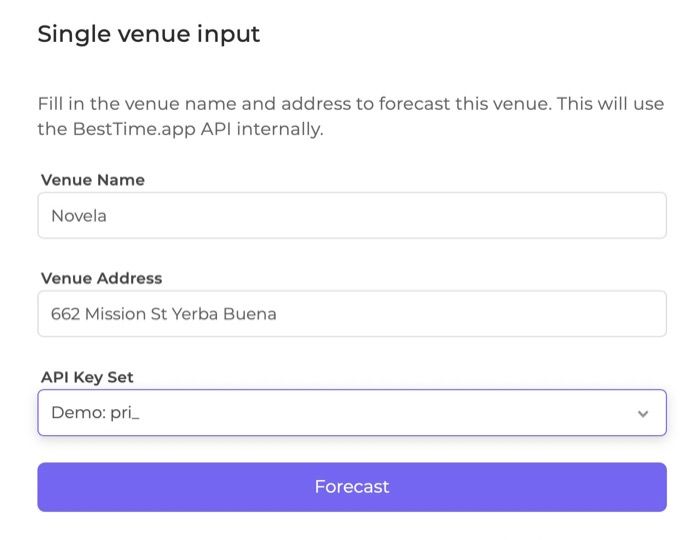
Click in the left main menu on 'New Foot-traffic data', and click then on 'Single Venue Search' to go to the Single venue forecasting tool. We type in "Novela" and select "Novela - 662 Mission Street, San Fransisco, CA" from the dropdown list. The address will be filled in automatically in the 'Venue Address' field. Click on the button 'Forecast' to continue.
If BestTime has enough foot traffic data for this venue it will load the next page with foot traffic data details for the bar. The bar is now also added to your user account.
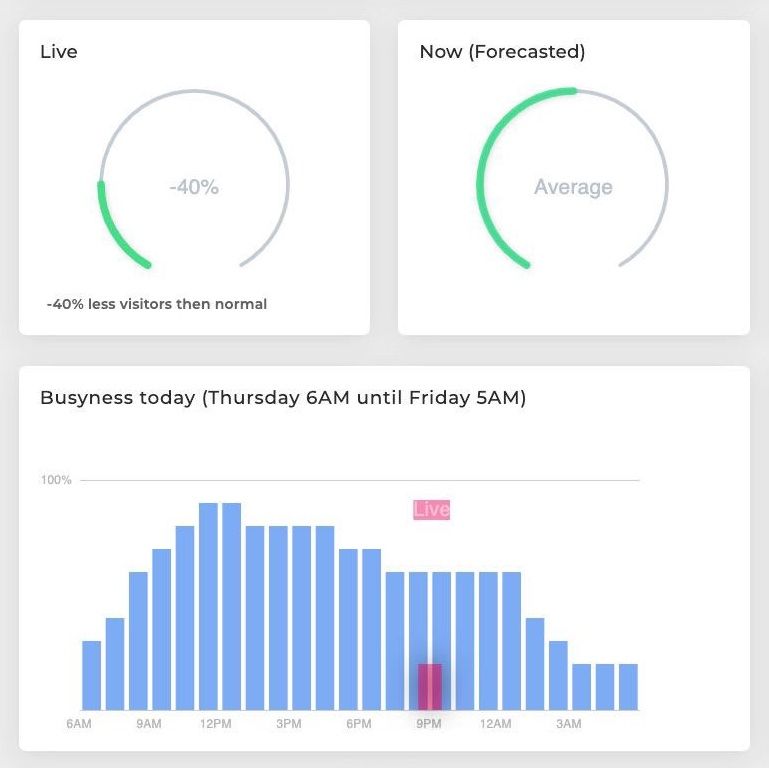
The blue bar charts show today’s foot traffic forecast per hour. The foot traffic data is expressed as a percentage from 0 to 100%, wherein 100% is the foot traffic peak of the week. If live data is available it will be displayed on the current hour in pink. The live percentage could go well above 100%. This means it is busier than the normal (forecasted) peak of the week. Click in the top right on 'Week' to get a week overview of the forecasted foot traffic.
If you add a new venue it could happen that an error will be displayed on top of the screen in red. It could mean 1) that BestTime has not enough foot-traffic data for this venue (at this moment), 2) the venue might be currently closed or closed the whole day, 3) it could not find the venue.
In the tutorial below, the foot-traffic data details will be discussed.
 Team BestTime
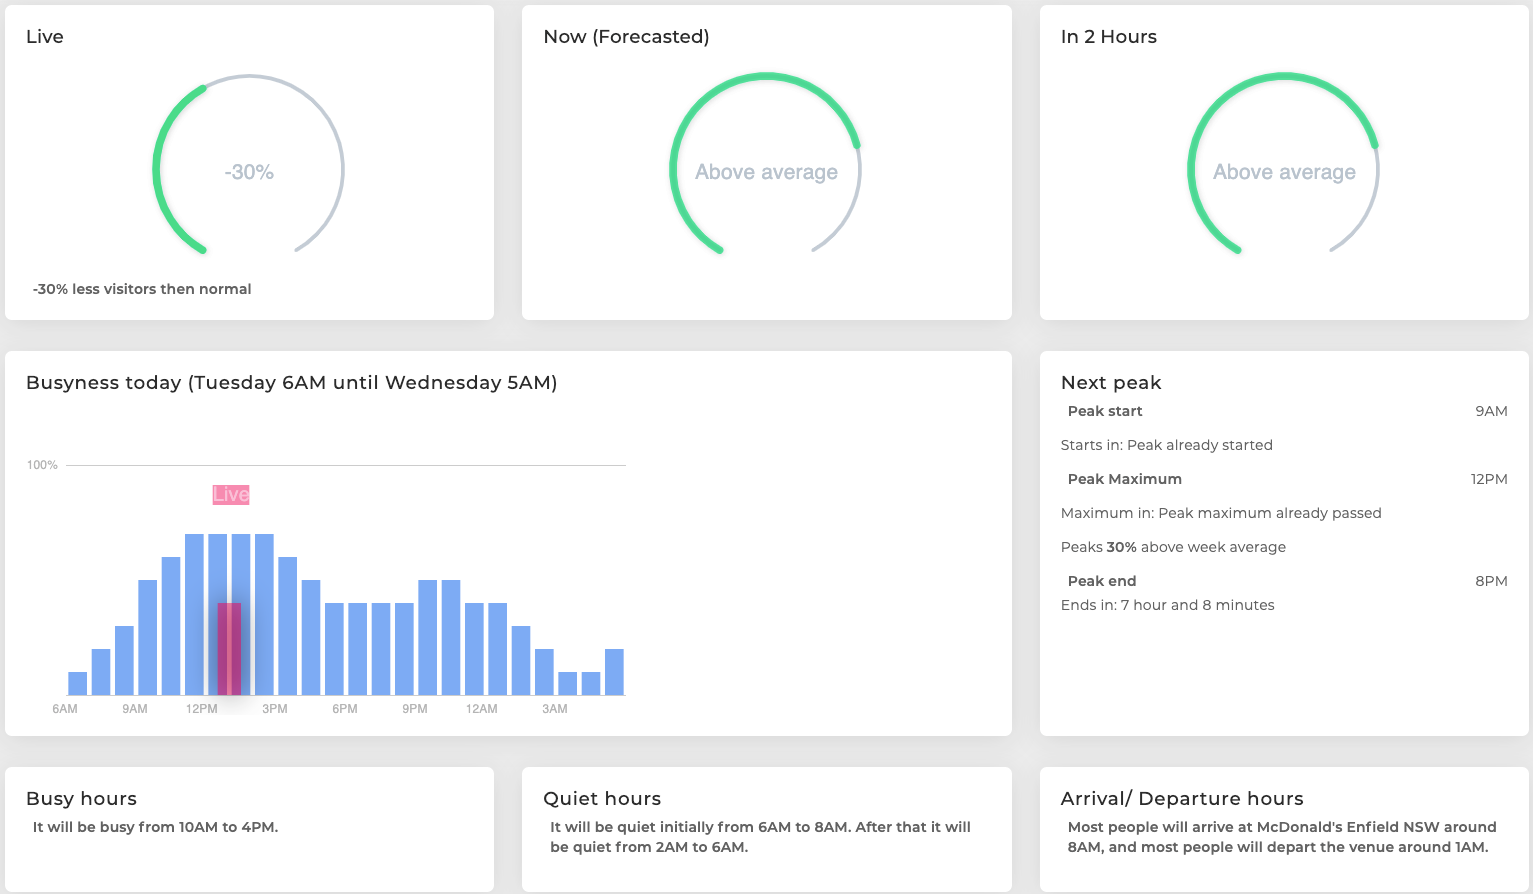
We go now back to the previous page and add another bar - Alchemist Bar & Lounge, 3rd street, San Fransisco - for demonstration purposes.
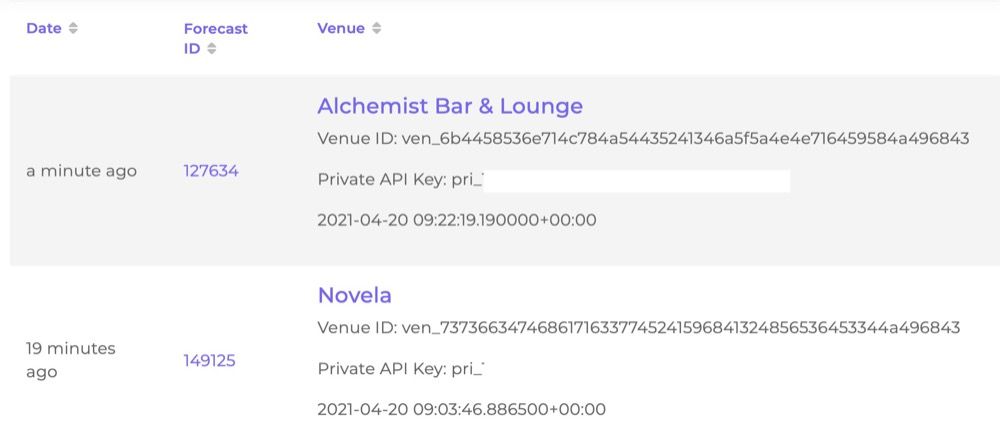
Foot-traffic overview
Click in the menu on 'My foot traffic' to get an overview of all the foot traffic data in your account. So far there are only two venues listed. Click on the name of the bar to go again to the foot-traffic data details of the specific bar.
Adding multiple venues using the 'Venue Search' tool
Let's say we don't know exactly the names of the bars, but we want to add some bars in the Mission District of San Fransisco to our account. Click in the left main menu on 'New Foot-traffic data', and click then on 'Search multiple venues' to go to the Venue Search Tool.
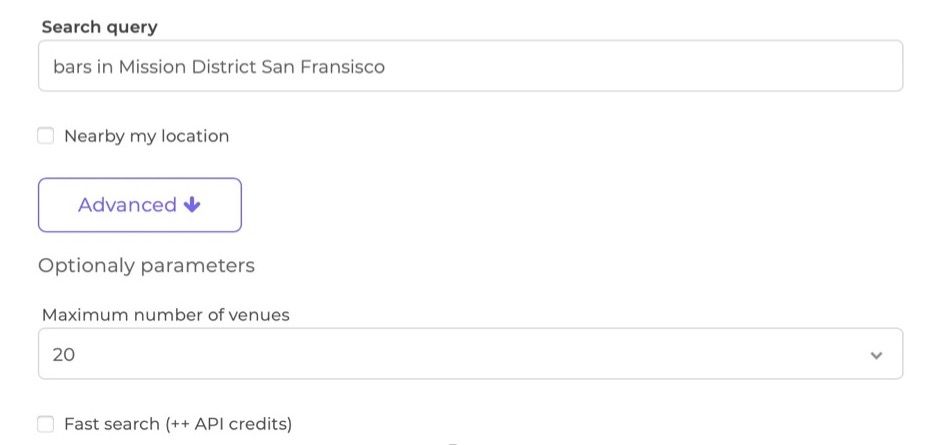
In the Search Query, we type 'bars in Mission District San Fransisco'. We uncheck the 'Fast Search' checkbox - after clicking on the Advanced button. For now, we select 20 as the maximum number of venues since the free account only includes a limited amount of credits. Alternatively, you can check 'Nearby my location' and only type 'bars' in the Search query to avoid having to specify the location. Check the technical Venue Search documentation for more options and information. Click the 'Search' button at the bottom to start the search.
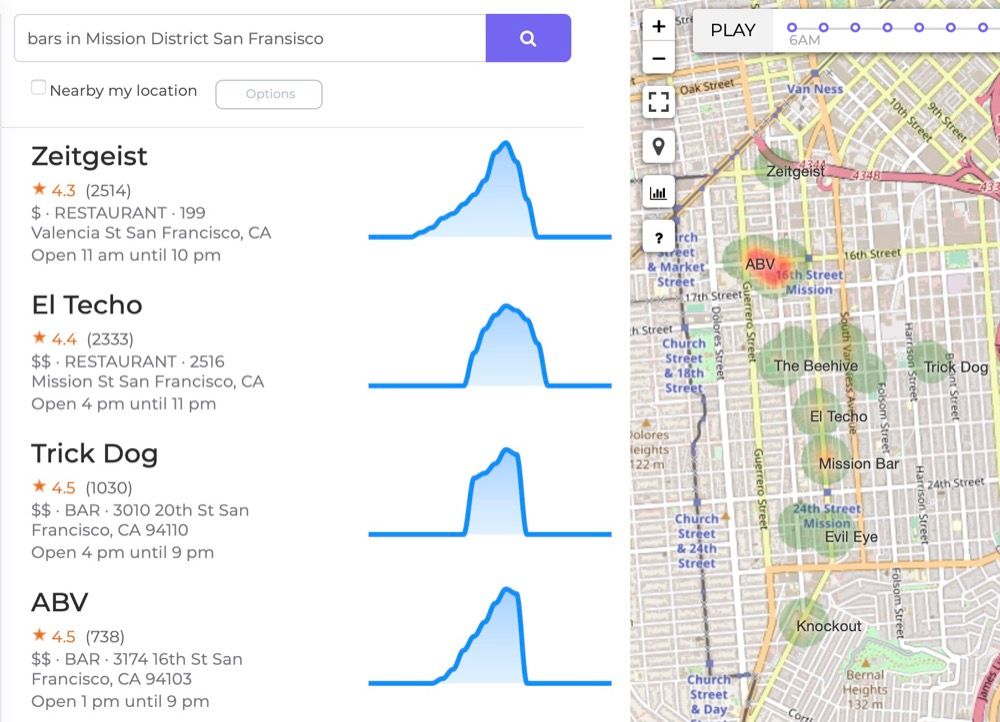
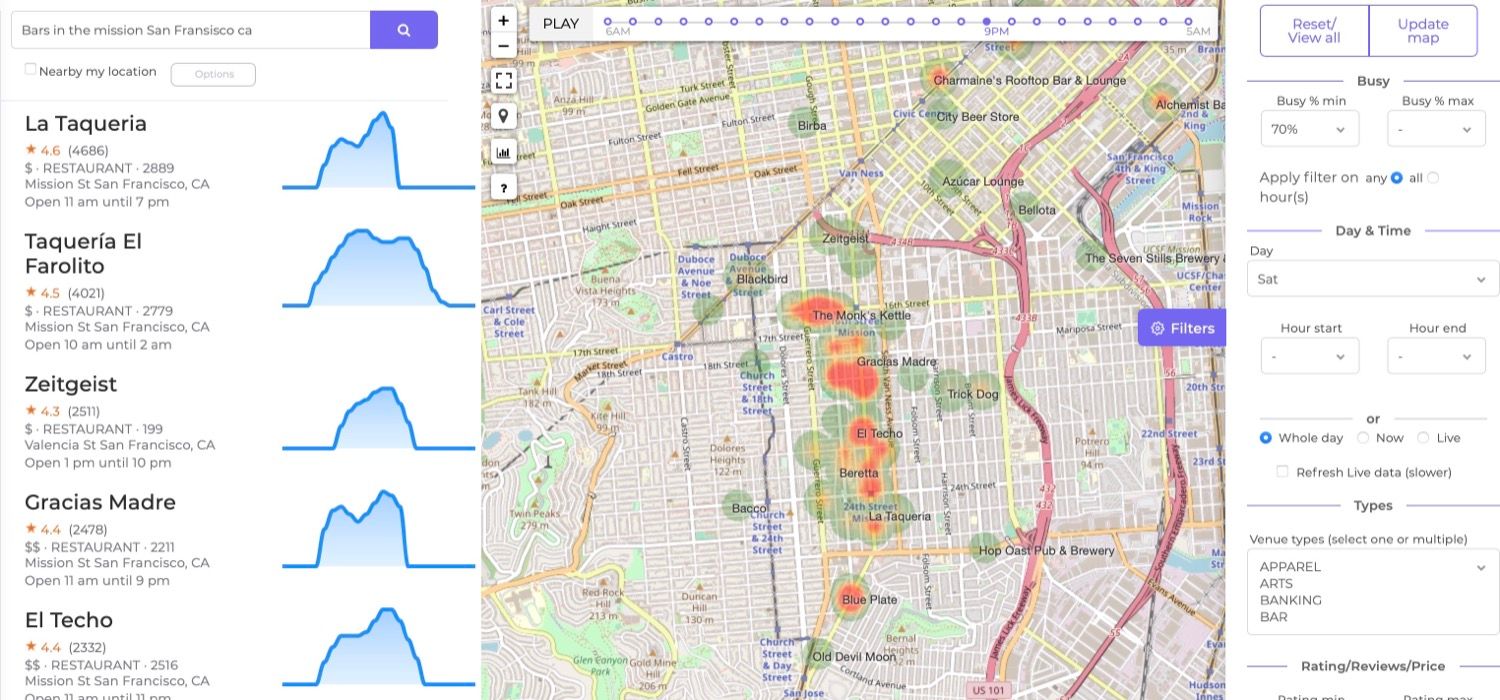
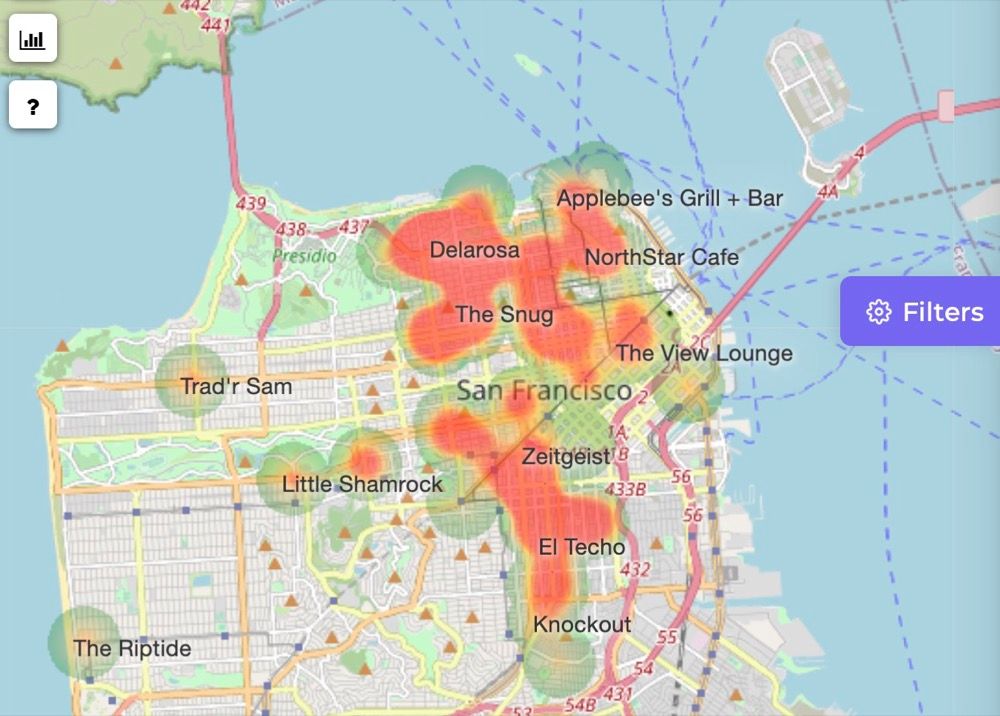
The Venue Search result will be automatically added to your user account and opened in the Radar Tool. The Radar tool is used to visualize and filter foot-traffic data of multiple venues at the same time. Not all bars matching your search result have foot-traffic data, so it could happen that you see less than 20 results.
On the left, you see the venue names and by default a chart with the foot-traffic prediction for today. Hover over the chart to see the predicted foot traffic percentages per hour. Click on the name of a venue to see more details.
In the middle of the screen, you will see a (heat)map with colored dots. When zoomed in enough, each dot represents a venue that is currently loaded in the Radar tool. The color represents the foot traffic intensity for the current hour, ranging from green (0%) to red (100%). You can also click on the heatmap to open foot traffic details of the corresponding venue.
Later we discuss the radar tool in more detail but first, we are going to add some more bars. The tutorial below also explains the Radar tool in more detail.
Team BestTime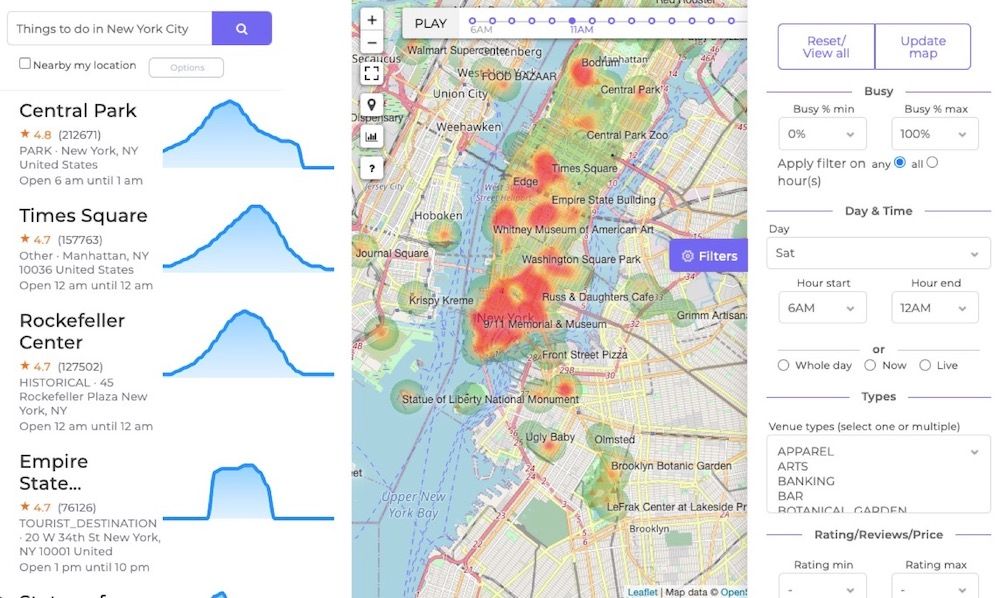
As you can see, the previously added bars (Novela and Alchemist Bar & Lounge) are not visible on the map or in the list on the left. When we perform a new Venue Search the search results are added to a 'Collection'. A collection is a group of venues. By default, the Radar Tool only displays the venues within that collection.
If we would perform a new Venue search query for bars in a different neighborhood the Radar tools would again only show venues from the last search result. If we want to display bars from multiple neighborhoods/ searches together we can do two things. The first option is to add the results from a new venue search to the existing loaded collection. The second option is to remove or reset the active filters.
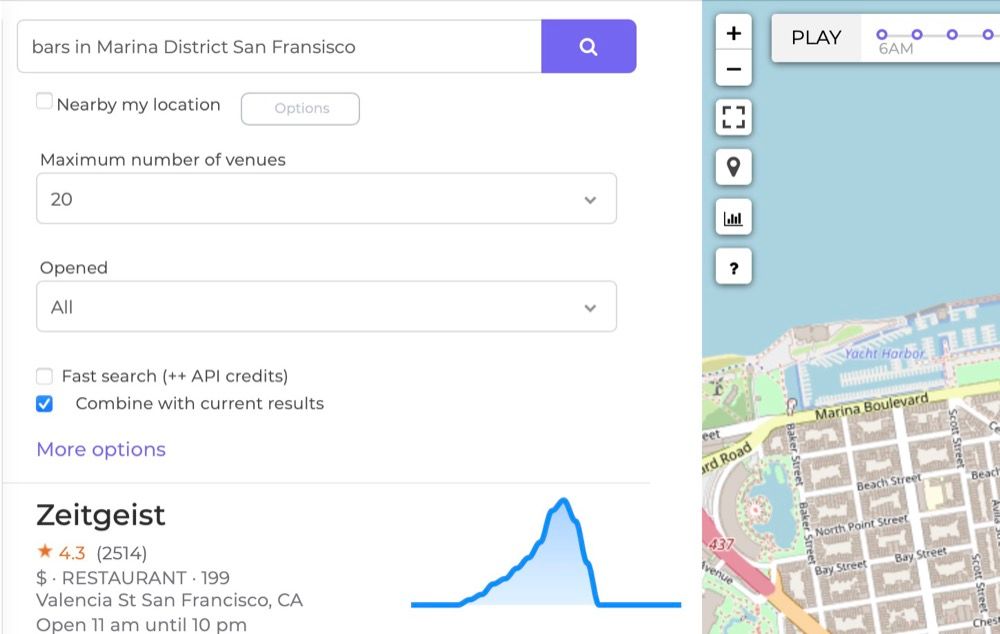
For option one, we add new venues again through a new Venue Search. However, this time we do this directly from within the Radar tool. In the top left of the screen, we type 'Bars in Marina District San Fransisco'. After that, we click on the 'options' button. We check the 'Combine with current results' checkbox and click on the purple search icon.
After loading the new search results will be displayed again in the Radar tool. The map is centered on the new results, but if you zoom them map out you will see the previous bars from the Mission District are also still visible.
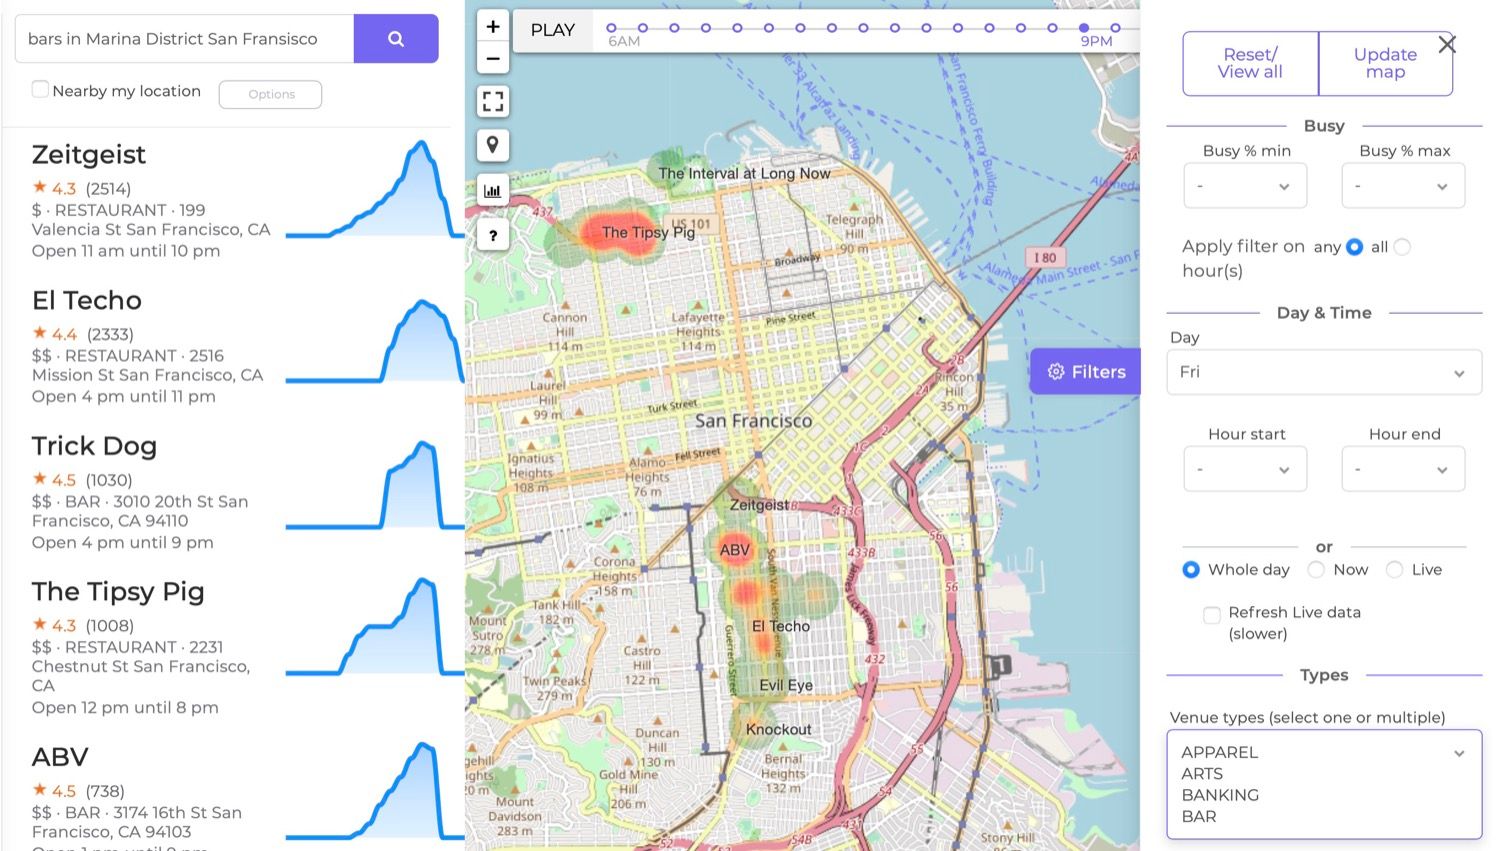
Now we will discuss the second option to display more venues in the Radar tool. On the right side of the Radar tool you see a panel full of buttons and filters. Using the filters you can narrow down the currently loaded venues on e.g. day, time, foot-traffic intensity, type, location, etc. Again, the tutorial below also explains the Radar tool and the filters in more detail.
Team BestTimeIf you scroll to the bottom of the filter panel you will see that the Collection field is filled with a collection id. That means the Radar tool will only display venues on the map that are currently part of the given collection. By removing the collection id from the field the Radar tool will load all venues, in this map location, that has been added before by this account (specifically this API key set). You can press enter after removing the id from the field, or you can press the 'Update Map' button in the top right of the screen.
Now the previously added bars 'Novela' and 'Alchemist Bar & Lounge' should also be visible in the Radar Tool. While writing this tutorial we added more venues already so that's why the image displayed below shows more data.
As an alternative to manually removing the collection id, you can press the 'Reset/ View all' button on the top-right of the Radar Tool. This will remove/reset all active filters in the Radar tool at the same time (useful when we later use more filters in the Radar tool).
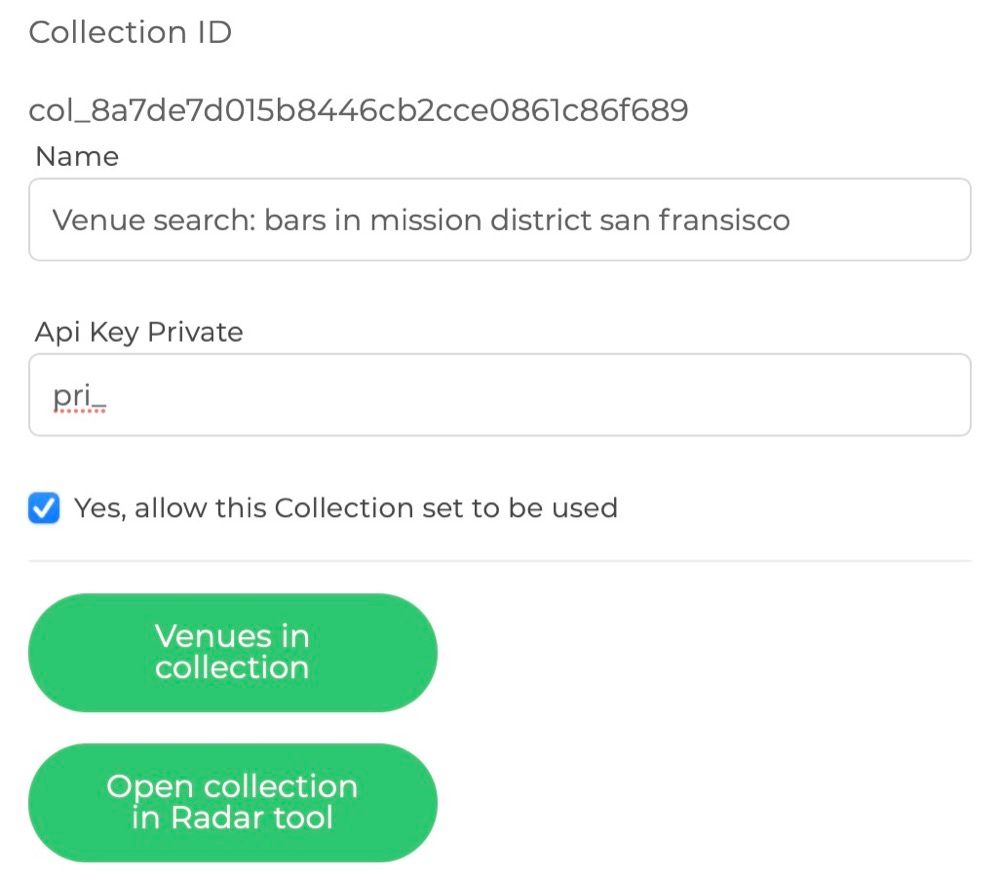
If we only want to show the venues from the previous collection again, you can do so by filling in the collection id in the Collection field. Alternatively, you can check all your collections on the Collection page. Collections can also be created, named, and managed (add/remove venues) through the API, but collections automatically created using the Venue Search tool will be named after the search query. By clicking on the collection id you can see a list of venues in the collection, or you can immediately open the collection in the Radar Tool.
Findings the right bar using filters
In previous sections, we discussed how to add new bars to your user account. Now discuss how to filter and display previously added bars that meet certain criteria. For example, we want to show only the bars that are busy on Friday from 9 PM until 11 PM in a 1-kilometer radius around you (or any desired location).
We start with the Radar Tool zoomed and centered in San Fransisco without any filters or loaded collections. You should see all previously added bars loaded.
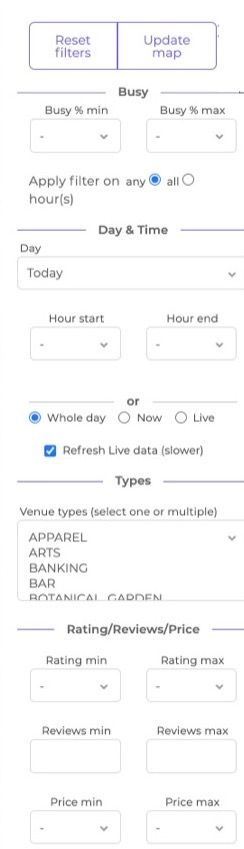
On the right side of the screen, you can see the Filter panel. By adding filters we narrow down the currently loaded bars that meet the filter criteria.
Note: Each time a filter is applied, new data is loaded and credits will be charged (see venue Filter credits).
Filter on day of the week
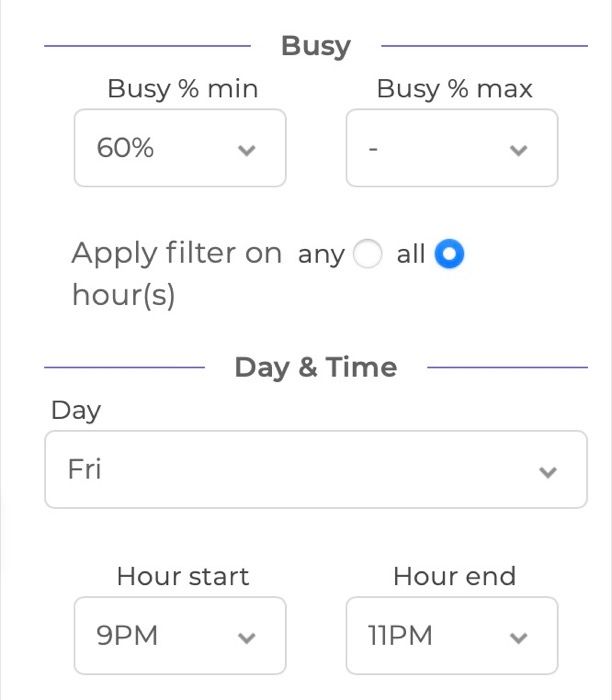
By default, the Radar view shows the foot traffic data for the current time of the day (in the timezone of the map). First, we change the day to 'Friday'. The list and map data will now automatically show the foot traffic data for Friday.
Filter on foot traffic intensity
Now we would like to only display bars that will be at least 60% busy on Friday. We therefore set the 'Busy min' value to 60%. Now all bars will be displayed that will be at least 60% busy somewhere during the day (from 6 AM until 5AM the next day).
Filter on time of day
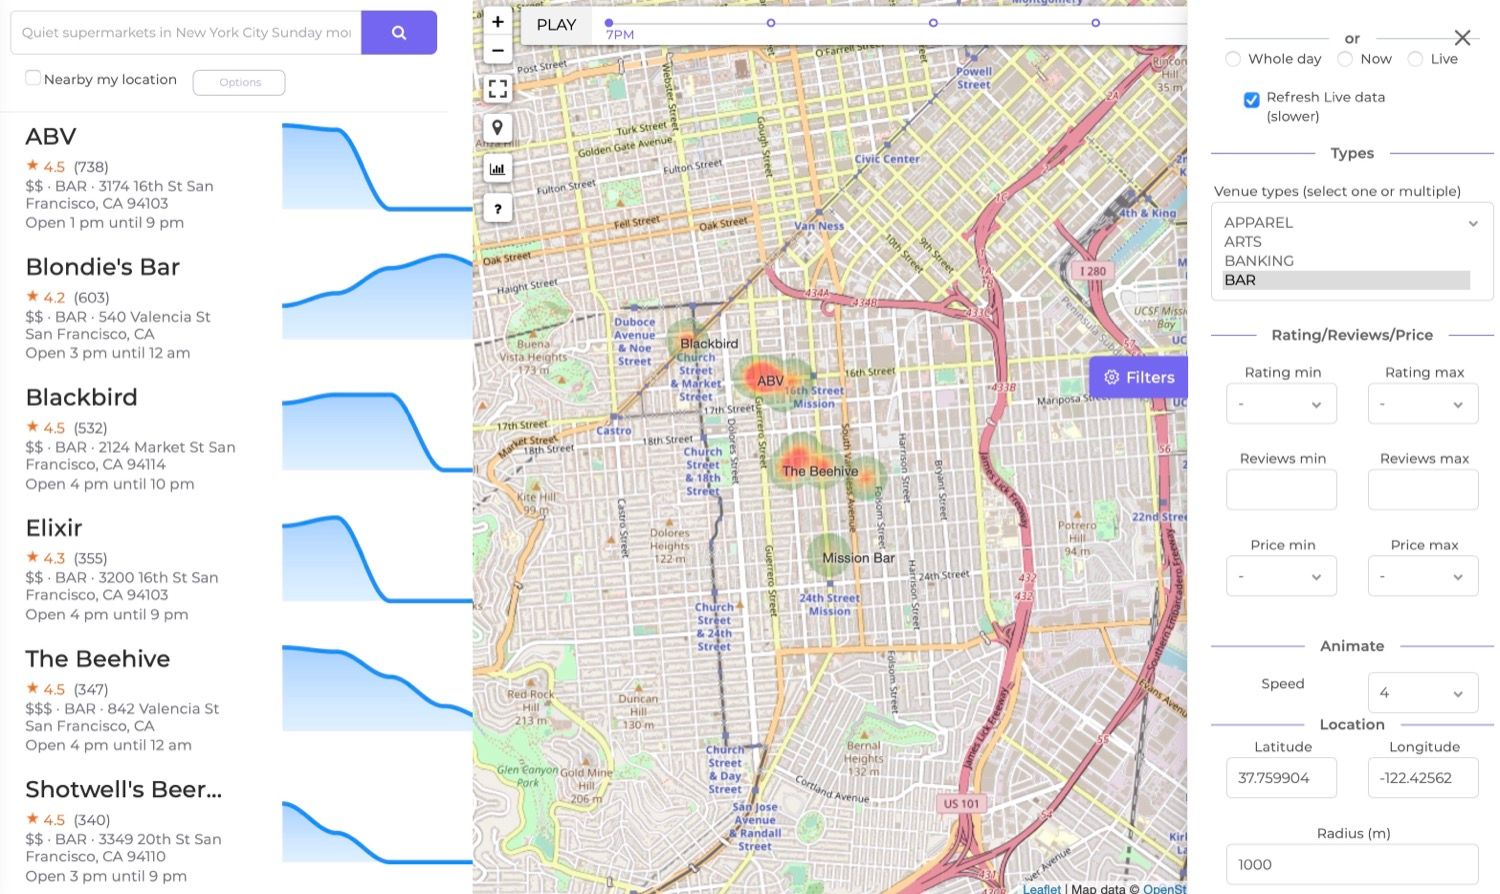
The resulting bars could in theory also be only busy at 11 AM and quiet during the remainder of the day. Therefore we, filter also on time by setting the 'hour min' to '9 PM', and the 'hour max' to '11 PM'. Now all bars that are at least 60% busy anywhere from 9 Pm until 11 PM on Friday in San Fransisco are displayed. If you want to only show bars where ALL hours are at least 60% busy, then you can click the 'all' radio button below the minimum busyness filter. On the left side in the venue list you will see that the charts only show the foottraffic forecast for the filtered hours. The timeline on top of the map will also only indicate the selected hours.
Filter on location
The next step is to narrow down to bars in a specific location. Previously we added new venues in the Martina and Mission district using the Venue Search tool. This automatically created a collection id for that search request. So we could fill in the collection ID in the filter panel to filter the current set of bars only to bars previously found in e.g. the Mission district.
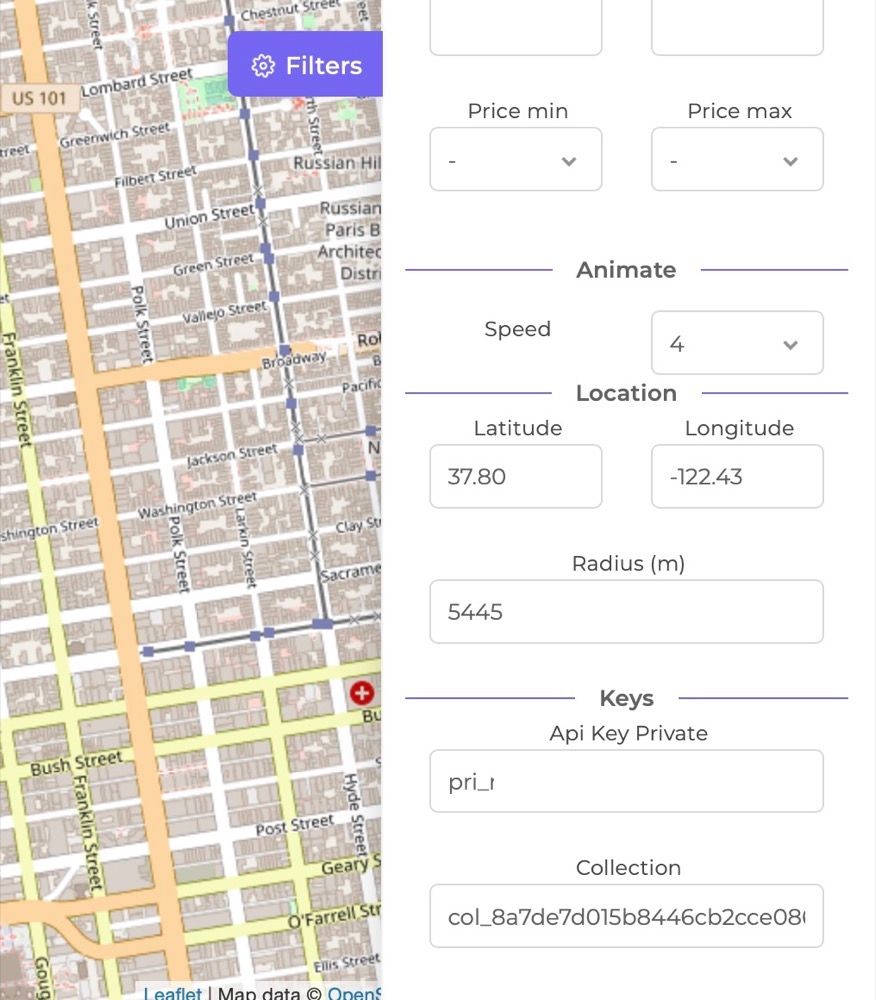
As an alternative to using a collection, we can filter down on geographical coordinates with a radius (using the API you can also filter on a bounding box instead of a radius).
We fill 37.759904 Deg latitude and -122.42562 Deg longitude in the location filter fields as the center of Mission District. We set the radius to 1000 meters, to only show bars in a 1 kilometer around the center of Mission District. If you move the map these values automatically update, so it's better to move to map to your desired view before filling in the coordinates and the radius.
Optionally, you could filter further on the rating, price level, and amount of reviews of the bar. Not all venues have a price level, therefore applying the price level filter removed all venues without that data from the results.
Showing data for the current hour
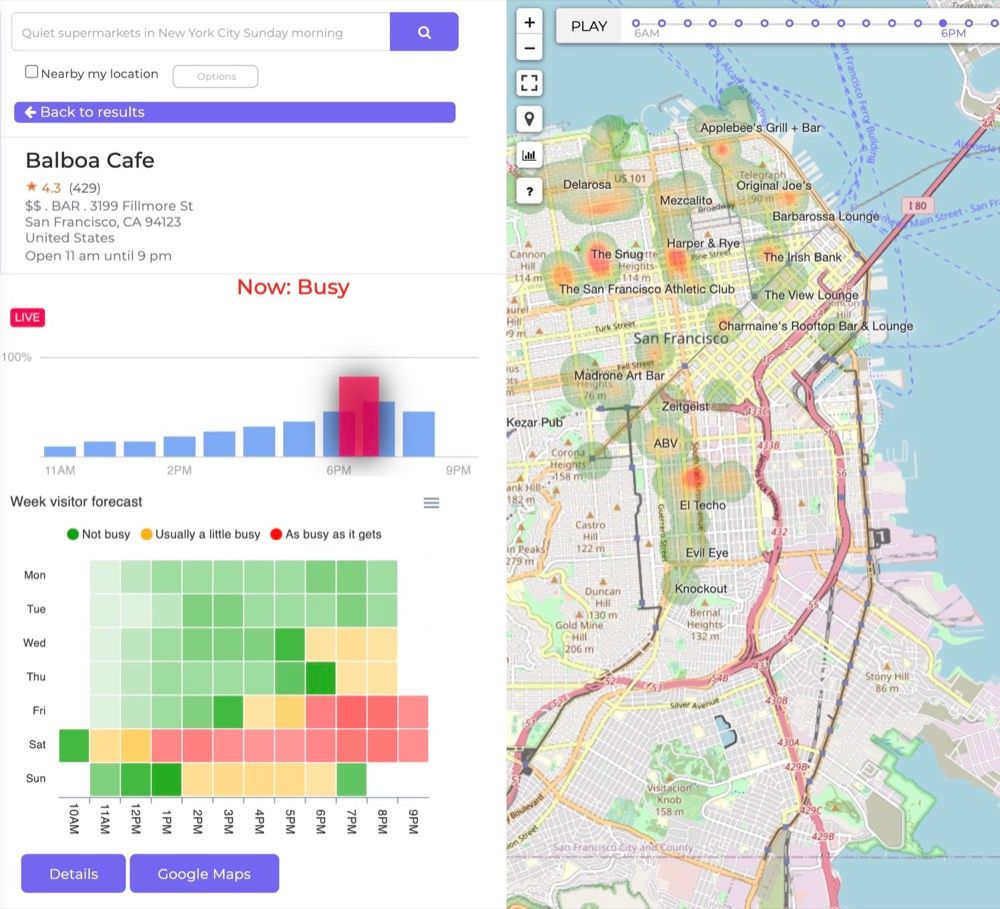
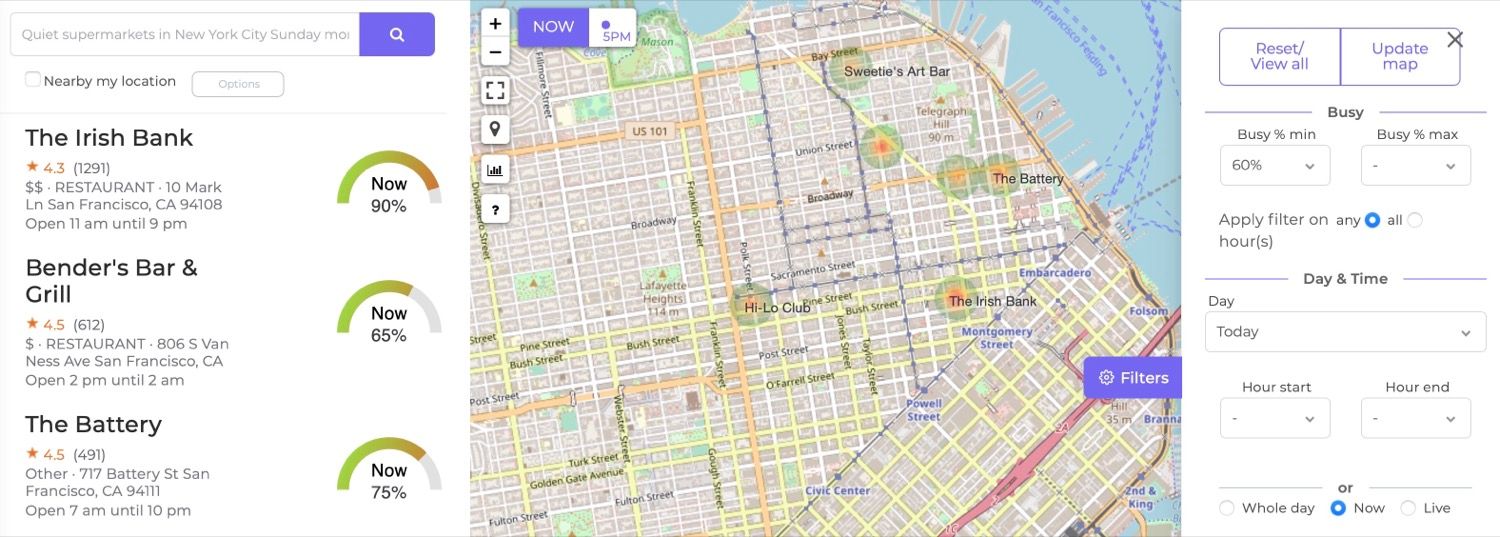
By selecting the 'Now' radio button in the Day & Time filter panel only foot-traffic data is loaded for today's current hour. The current hour is depending on the time zone of the map location. The charts in the left venue list view are now also replaced by gauges indicating the foot traffic intensity for the current hour. We now set the 'Busy' minimum value to 60% again to only show venues that are predicted to be at least 60% busy at this moment.
Real-time foot traffic data (live data)
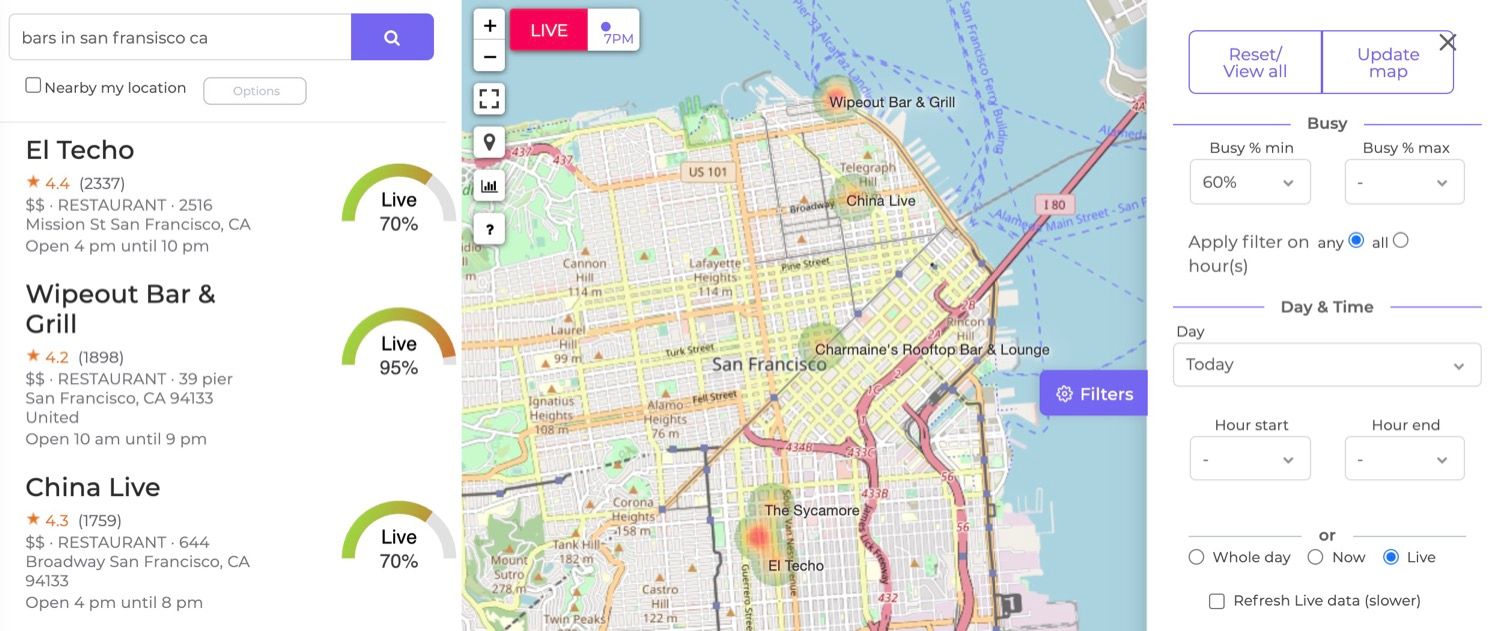
So far we only applied filters on foot traffic forecast (prediction) data. This hourly forecast is made by analyzing visits to a venue in the past weeks. BestTime also provides live data for some venues. Click in the 'Day & Time' filter panel section on 'Live' to only show venues that have live data.
Live data is based on the number of visits in the current hour of a venue. Live foot traffic data is also displayed as a relative percentage and is most useful to determine if it's currently much more or less busy than usual (compared to the foot traffic forecast). If the forecast indicates 70% and the Live foot traffic data indicates 40% as foot traffic prediction, it means that it is now approximately 30% less busy than usual for the current hour. A forecasted value of 100% indicates the predicted foot traffic peak of the week. However, live data could go well above 100% in some cases. Then the live data indicates for example 140% it means that it is currently 40% more busy compared to the forecasted peak of the week.
Unfortunately, not all venues, that have foot traffic forecast data, have live data available. In general, the bigger or more popular venues have live data. Live data is only available when a venue is open (in contrast to forecast data).
To save resources & API credits and increase the response speed, the Radar tool will load Live data without refreshing it. Click the 'Refresh Live data' checkbox to refresh the live data for all currently displayed venues. When you've added the bars in the past hour the data is fresh enough. You will notice this takes significantly longer to load the data. We recommend refreshing the data only once per hour.
Next steps
We've now discussed how to add and filter foot traffic data through the BestTime website tools. However, BestTime's main purpose is to provide foot traffic data through the software API. All previously mentioned tools in this tutorial are built on top of the same software API. In the next tutorial, we will take the same steps to add venues and filter them but this time through the software API.
Also check out the following tutorials below for more detailed information on the Radar Tool, Venue Search, and Forecast tool.
Team BestTimeTeam BestTime